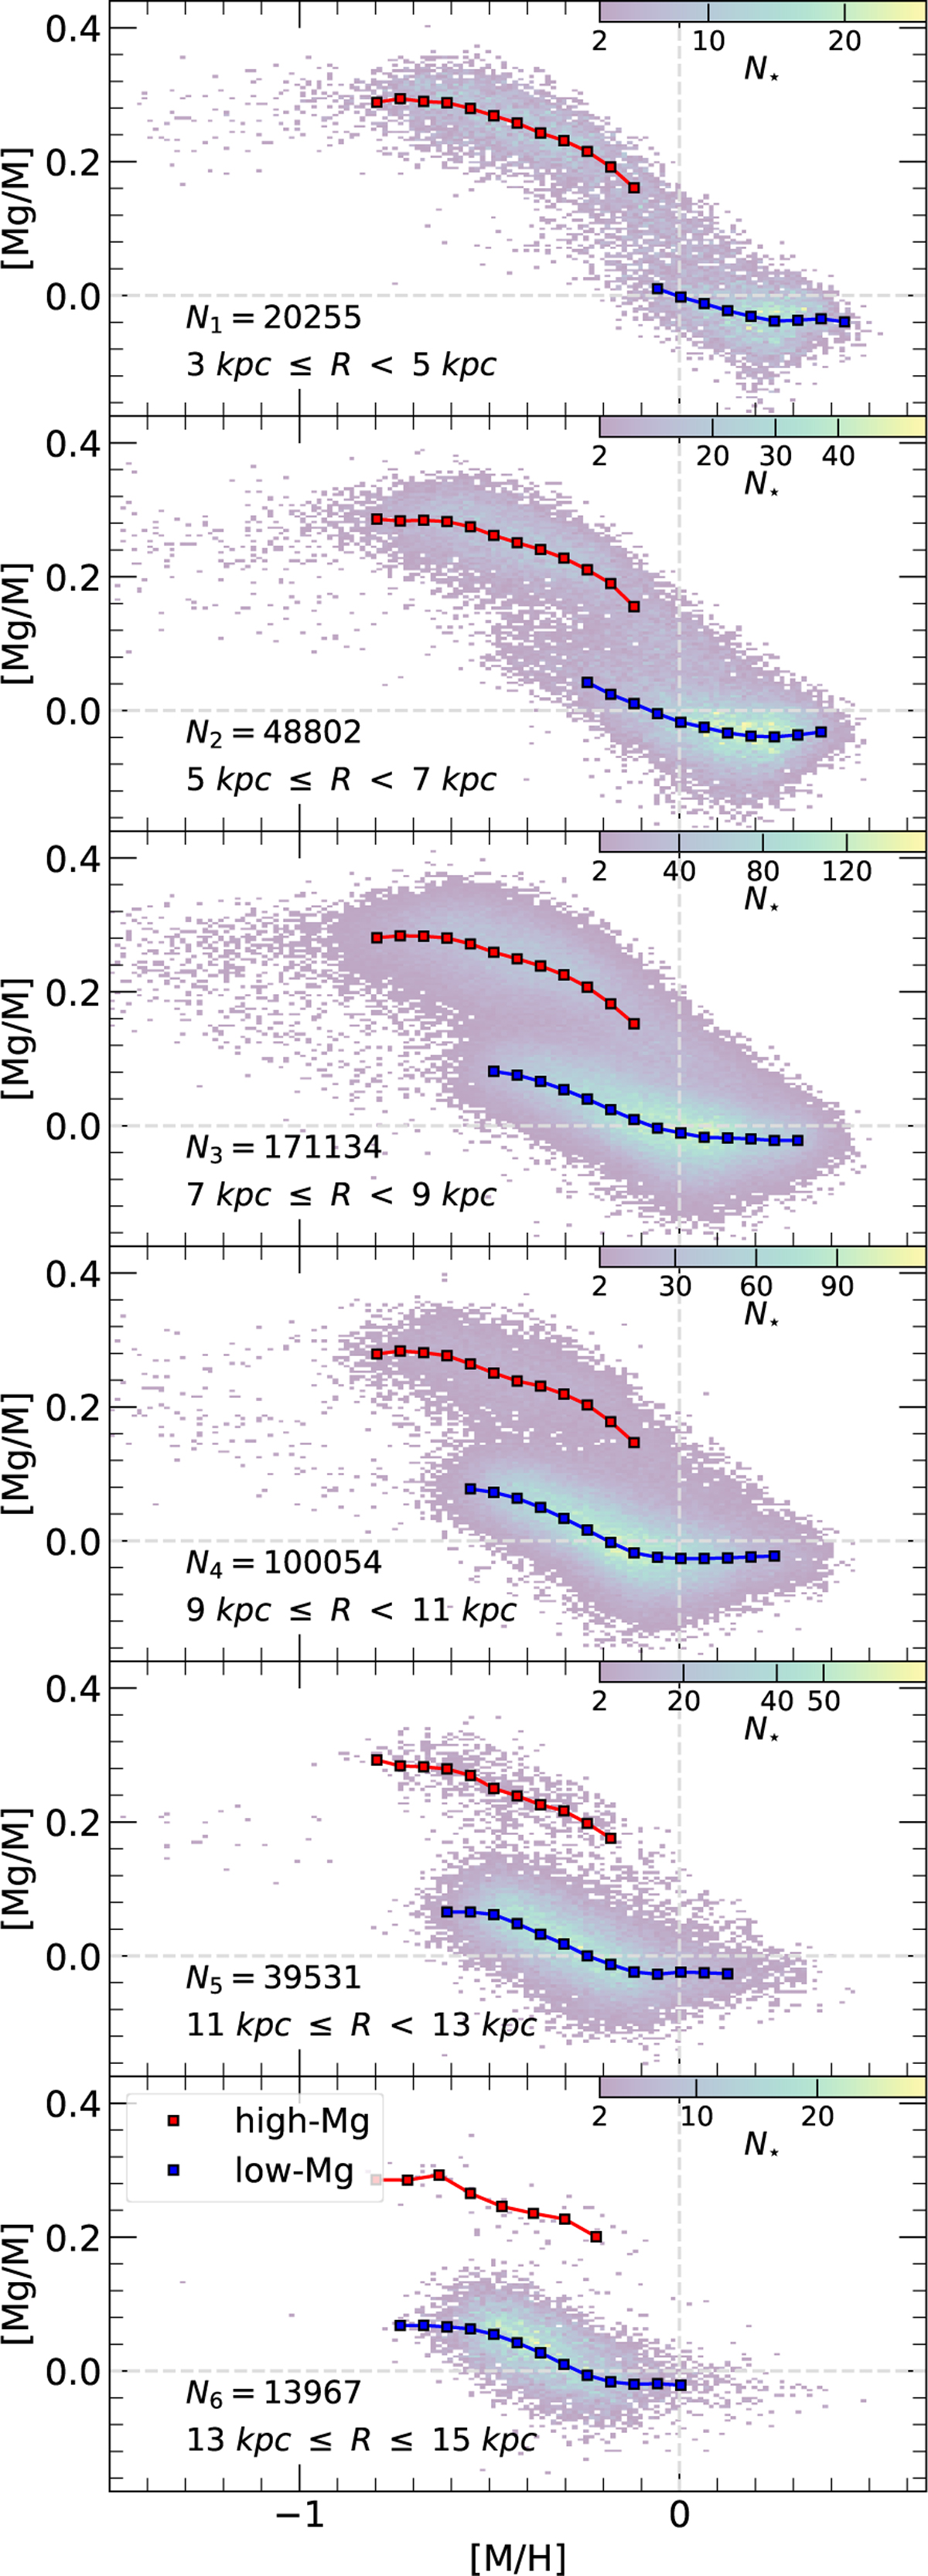
Fig. 3
Download original image
Observed stellar [Mg/M] vs. [M/H] abundance ratios from MWM DR19 (Meszaros et al., in prep.) for the six bins of different Galactocentric distances considered here. The regions plotted from the top are all 2-kpc-wide, and are centered at R1 = 4 kpc, R2 = 6 kpc, R3 = 8 kpc, R4 = 10 kpc, R5 = 12 kpc, and R6 = 14 kpc, respectively. The sample size in the i-th region is denoted by Ni. Red and blue squares represent the binned distributions of the high-Mg and low-Mg sequences, respectively. Details on the data selection are reported in the text.
Current usage metrics show cumulative count of Article Views (full-text article views including HTML views, PDF and ePub downloads, according to the available data) and Abstracts Views on Vision4Press platform.
Data correspond to usage on the plateform after 2015. The current usage metrics is available 48-96 hours after online publication and is updated daily on week days.
Initial download of the metrics may take a while.