Fig. 2
Download original image
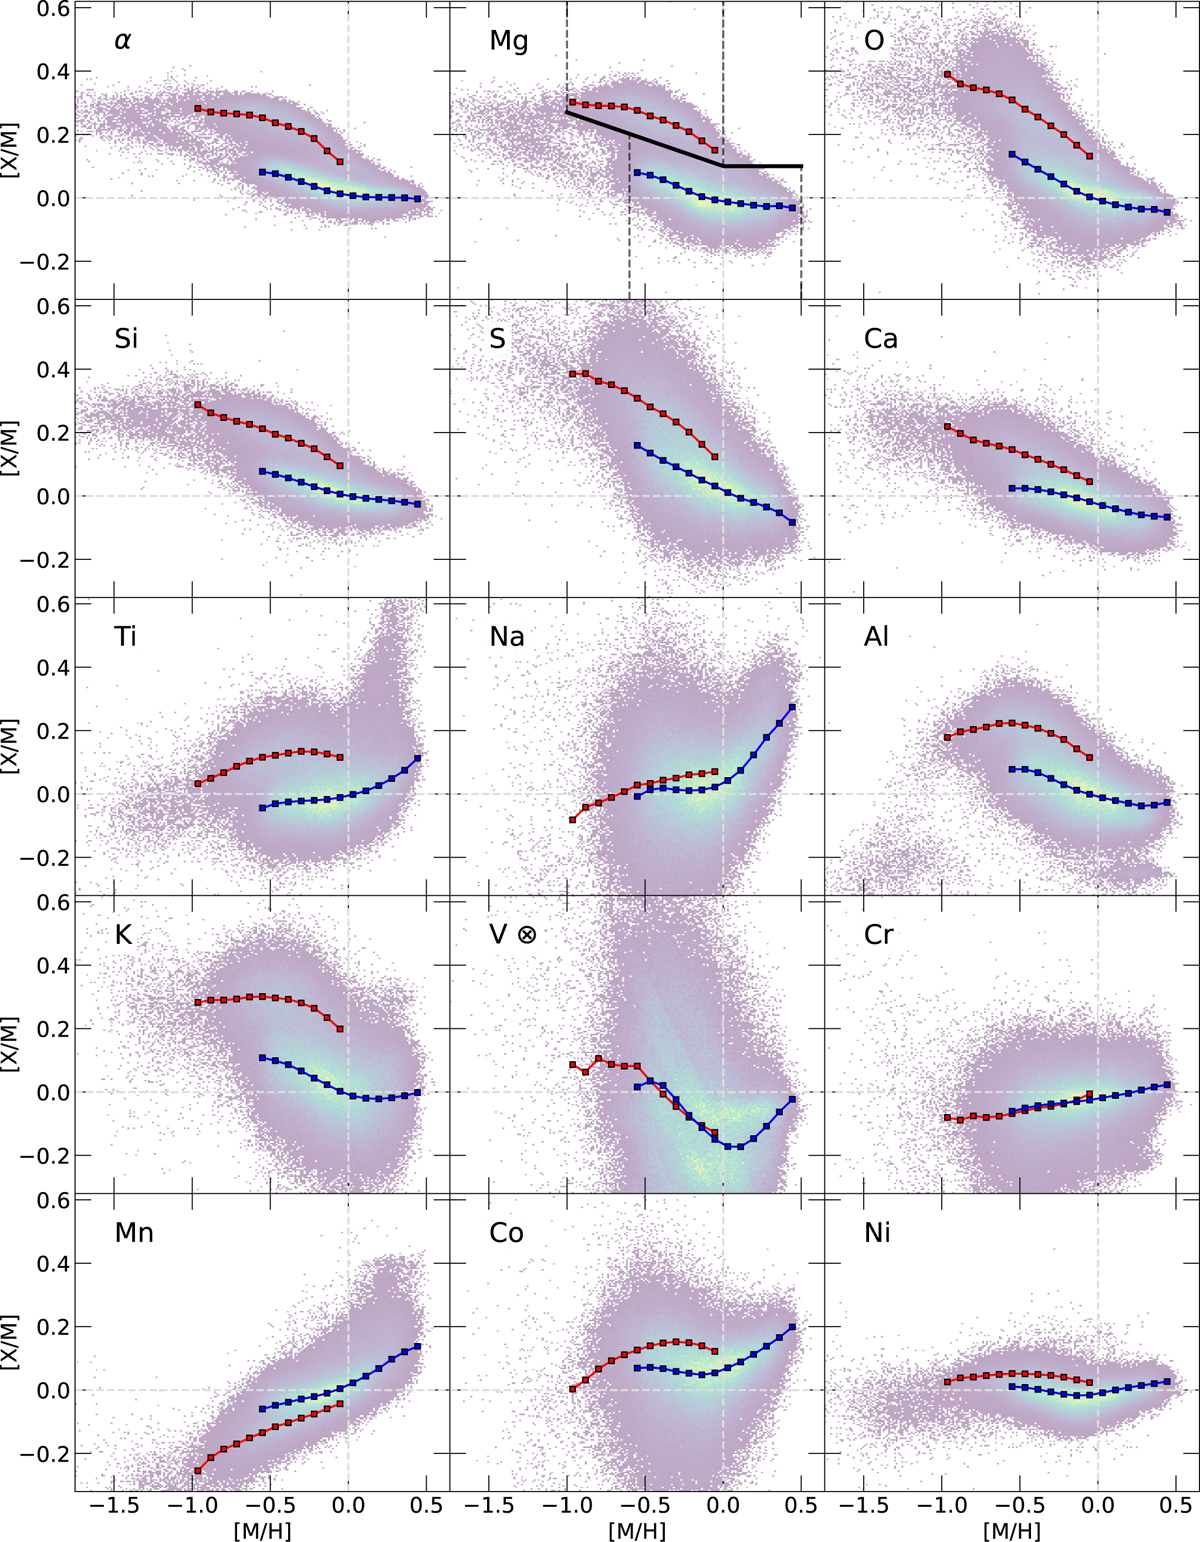
Chemical map of the Galaxy observed by MWM. The [X/M] vs. [M/H] relations are shown for the combined α-elemental ratio as well as the single elements from Mg to Ni for the global disk sample. Red and blue curves represent the median trends of the high- and low-Mg stars separated based on their Mg abundance. This separation and the metallicity boundaries of the thick and thin disk stars are indicated by the black solid and dashed lines in the panel of Mg. Note: ⊗ drives caution to V because of the high observational uncertainty.
Current usage metrics show cumulative count of Article Views (full-text article views including HTML views, PDF and ePub downloads, according to the available data) and Abstracts Views on Vision4Press platform.
Data correspond to usage on the plateform after 2015. The current usage metrics is available 48-96 hours after online publication and is updated daily on week days.
Initial download of the metrics may take a while.