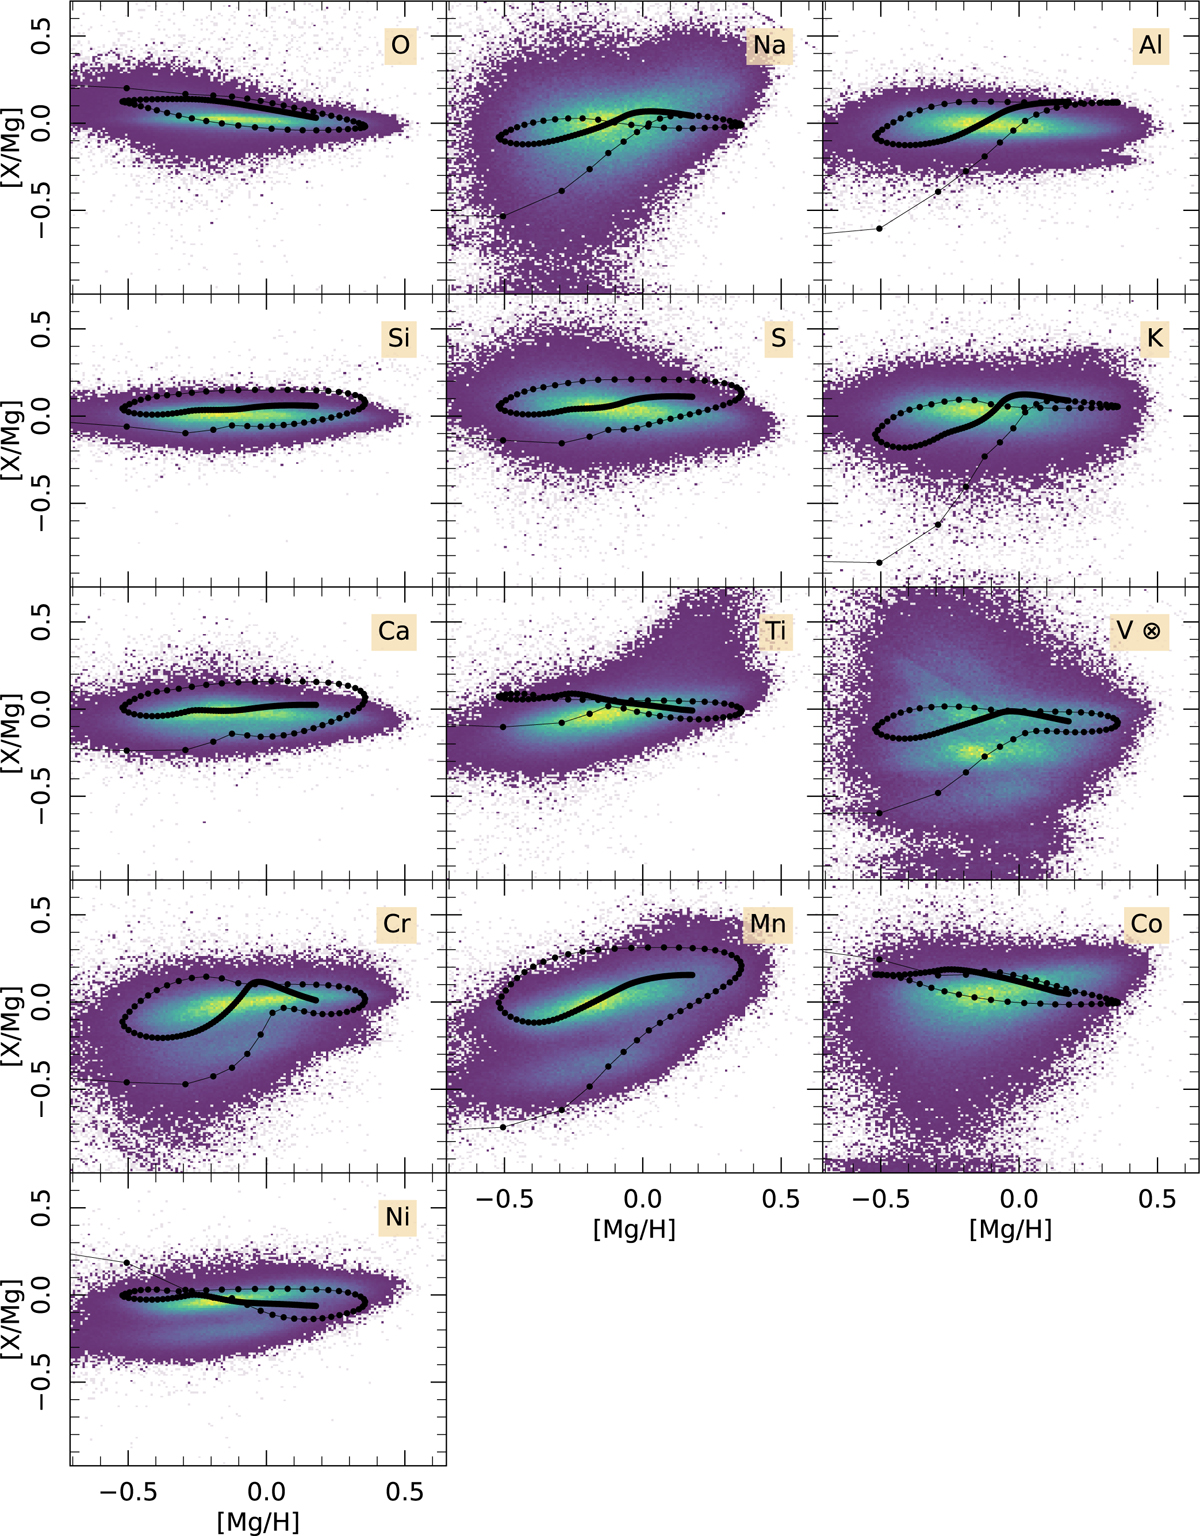
Fig. 13
Download original image
Observed [X/Mg] vs. [Mg/H] abundance ratios for the α- and odd-Z elements from MWM DR19 throughout the entire galactocentric region between 3 and 15 kpc compared with the best-fit CE model results (dotted curves) for all species. The color coding represents the number of stars on the observational chemical map of the MW, and gray squares represent bins containing a single star. Note: ⊗ drives caution to V because of high observational uncertainty.
Current usage metrics show cumulative count of Article Views (full-text article views including HTML views, PDF and ePub downloads, according to the available data) and Abstracts Views on Vision4Press platform.
Data correspond to usage on the plateform after 2015. The current usage metrics is available 48-96 hours after online publication and is updated daily on week days.
Initial download of the metrics may take a while.