Fig. 1
Download original image
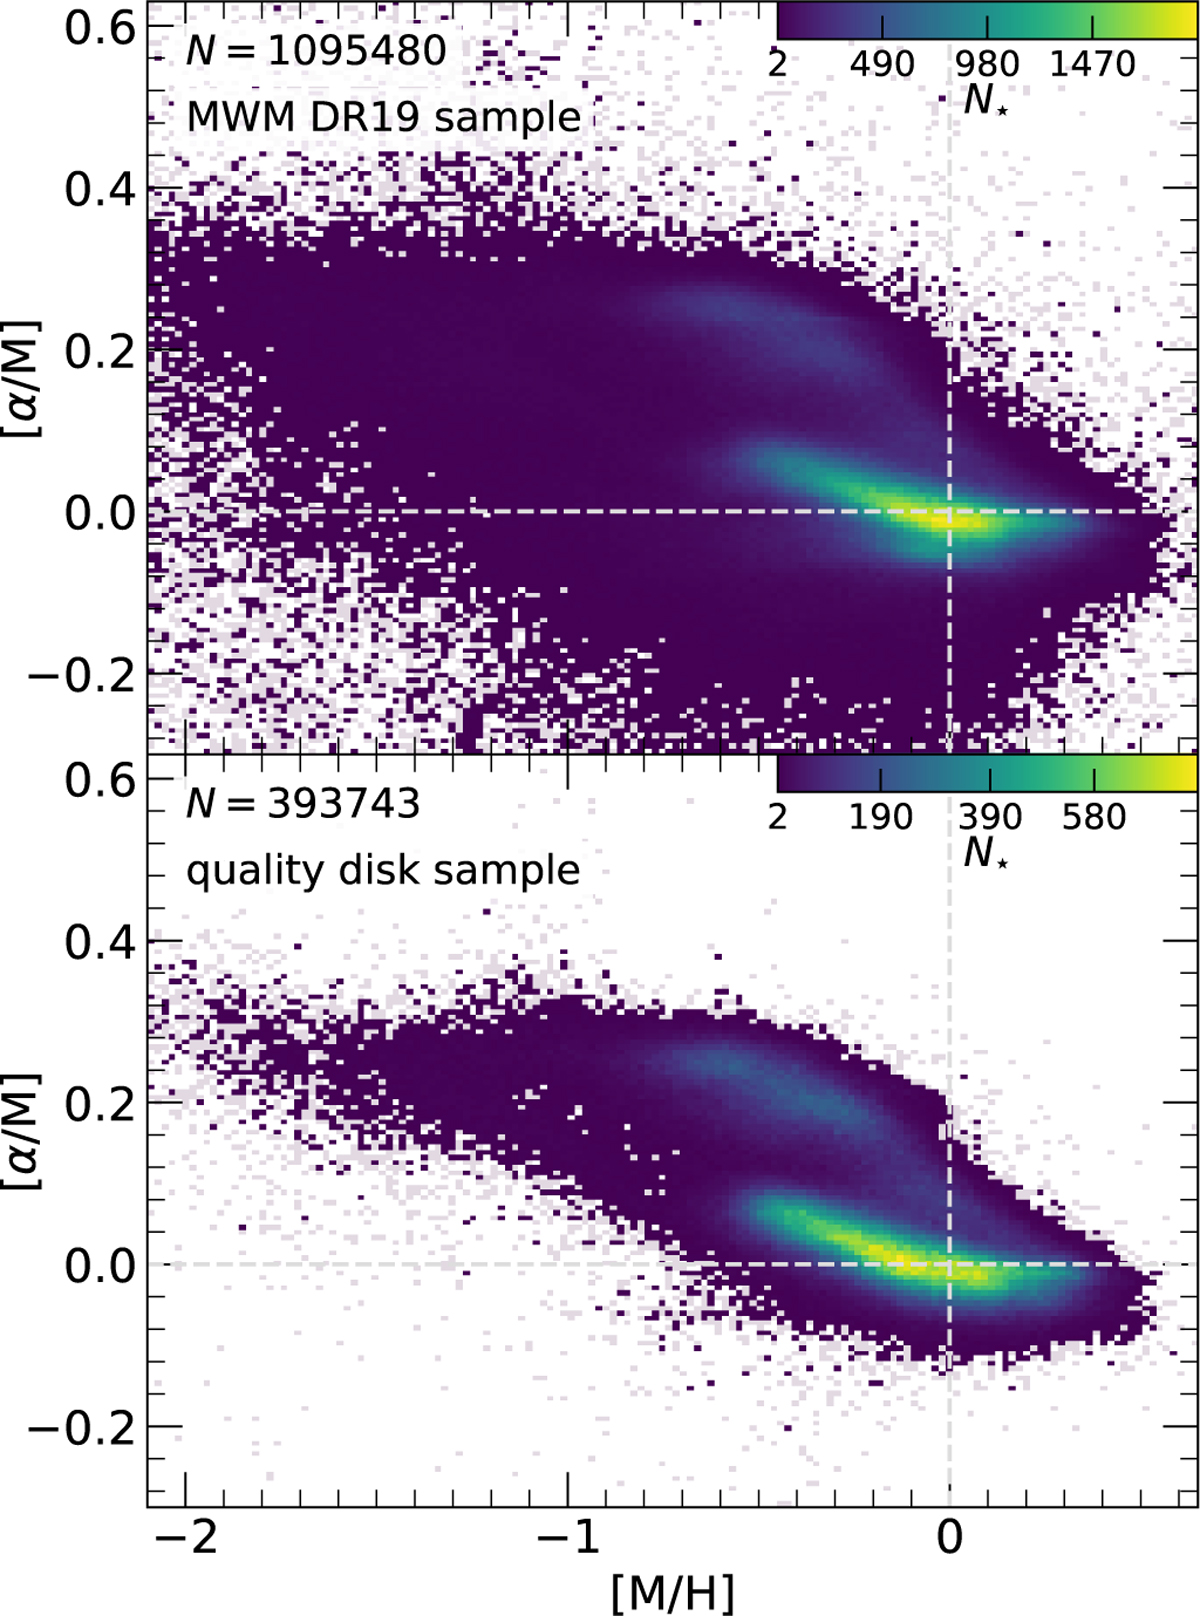
Observed stellar [α/M] vs. [M/H] abundance ratios from MWM DR19 (Meszaros et al., in prep.). The top panel shows a density plot for all the stars published, while the disk stars involved in the quality disk sample at the galactocentric regions 3 kpc ≤ R ≤ 15 kpc are depicted in the bottom panel. Color-coding of the bins starts from two, and gray squares represent bins containing a single star. The total number of stars is denoted by N.
Current usage metrics show cumulative count of Article Views (full-text article views including HTML views, PDF and ePub downloads, according to the available data) and Abstracts Views on Vision4Press platform.
Data correspond to usage on the plateform after 2015. The current usage metrics is available 48-96 hours after online publication and is updated daily on week days.
Initial download of the metrics may take a while.