Fig. 7
Download original image
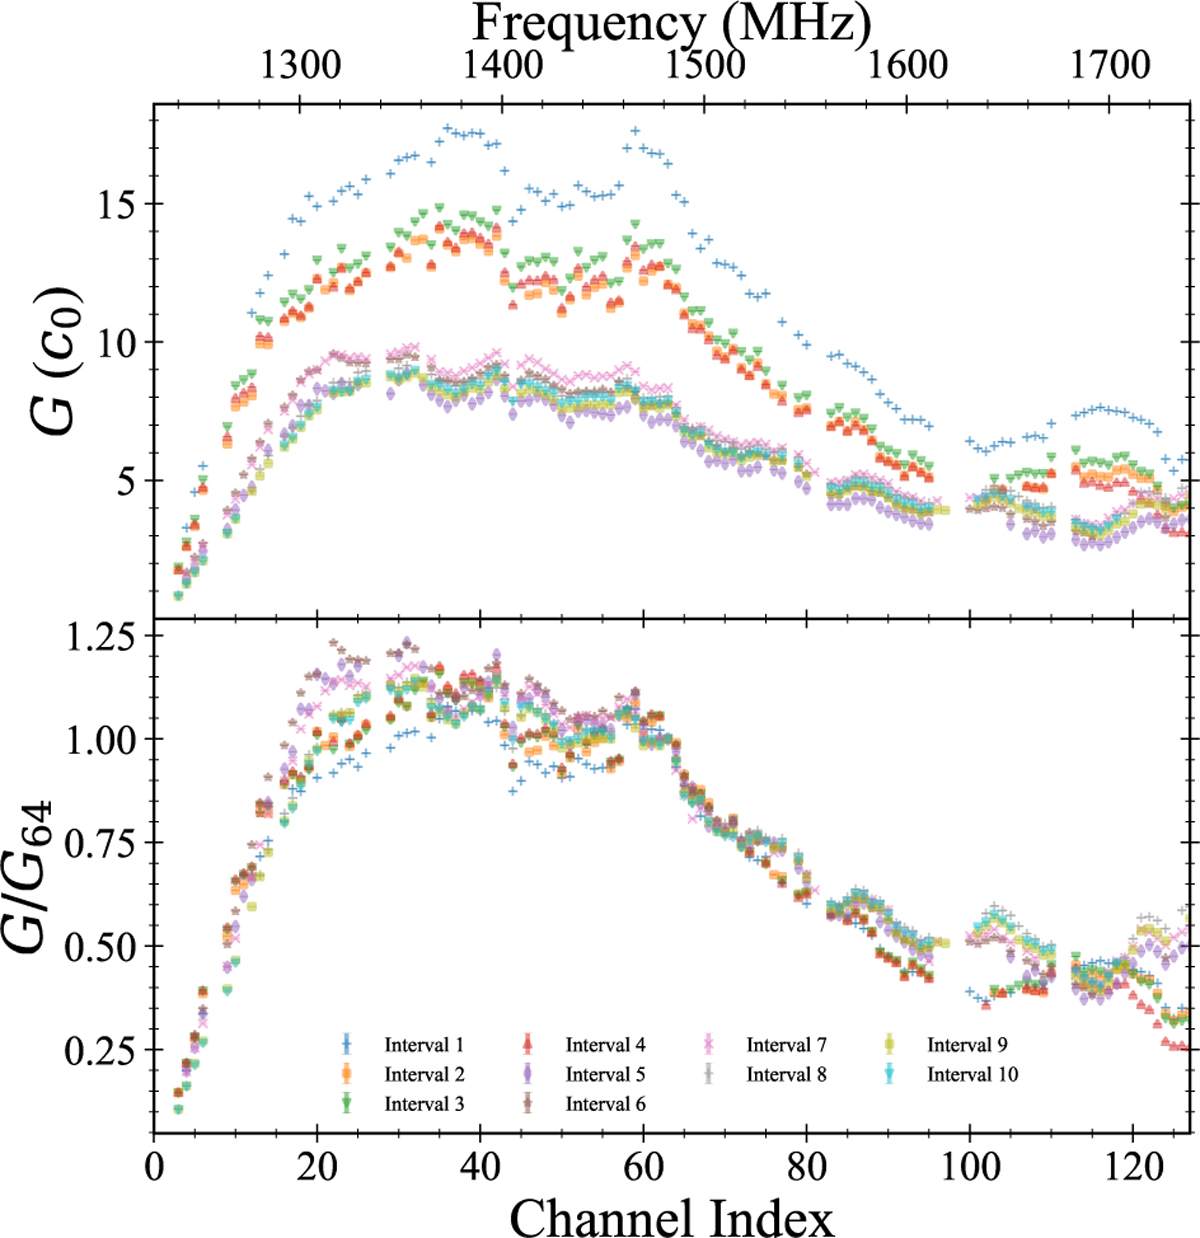
Top: gain parameter G as determined from the METM analysis of individual observations selected within each of the time intervals delimited in Fig. 6. Bottom: gain parameters divided by the value found for the 64th frequency channel. While discontinuities between intervals can be readily seen from the bottom panel, we note that in certain time intervals the discontinuities were more visible in other calibration parameters.
Current usage metrics show cumulative count of Article Views (full-text article views including HTML views, PDF and ePub downloads, according to the available data) and Abstracts Views on Vision4Press platform.
Data correspond to usage on the plateform after 2015. The current usage metrics is available 48-96 hours after online publication and is updated daily on week days.
Initial download of the metrics may take a while.