Fig. 11
Download original image
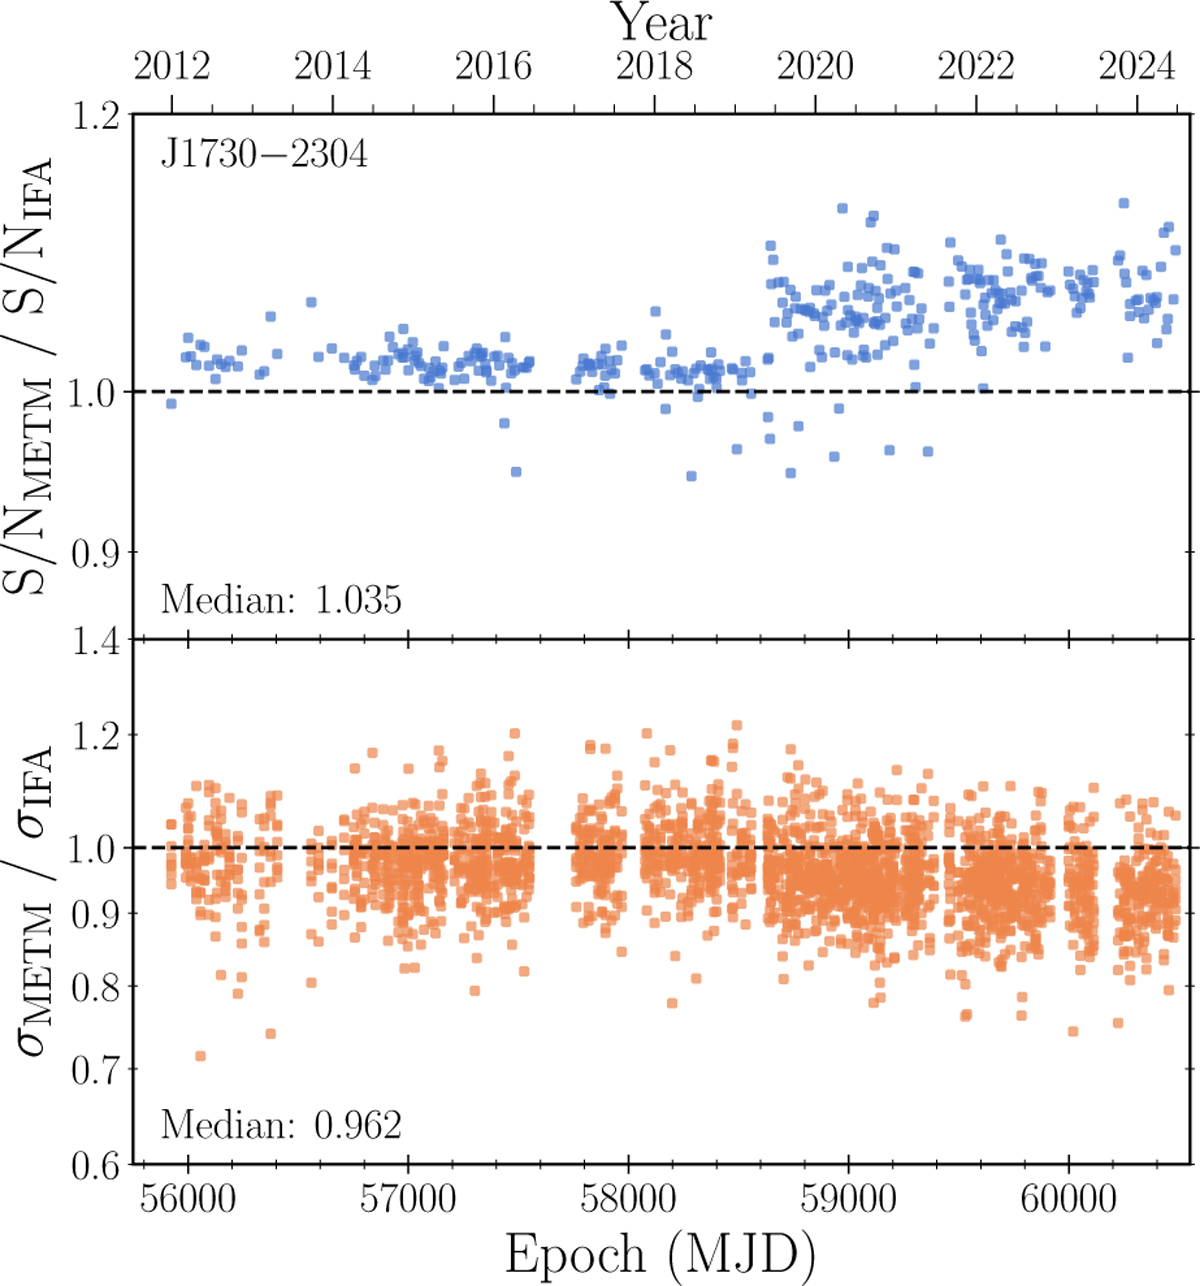
Ratios of S/N and TOA uncertainty values for PSR J1730-2304 as a function of time. Signal-to-noise ratio (S/N) and TOA uncertainty values (σ) were derived from NUPPI observations at 1.4 GHz, calibrated using the IFA method and the calibration method presented in Sect. 3. Individual NUPPI observations were fully integrated in time and integrated in frequency so as to form eight sub-bands of 64 MHz each. TOAs whose uncertainties are shown in this figure were extracted from individual observations using the FDM algorithm (see Sect. 4.1 for additional details on the analysis, and Appendix B for equivalent figures for the other analyzed MSPs).
Current usage metrics show cumulative count of Article Views (full-text article views including HTML views, PDF and ePub downloads, according to the available data) and Abstracts Views on Vision4Press platform.
Data correspond to usage on the plateform after 2015. The current usage metrics is available 48-96 hours after online publication and is updated daily on week days.
Initial download of the metrics may take a while.