Fig. 10
Download original image
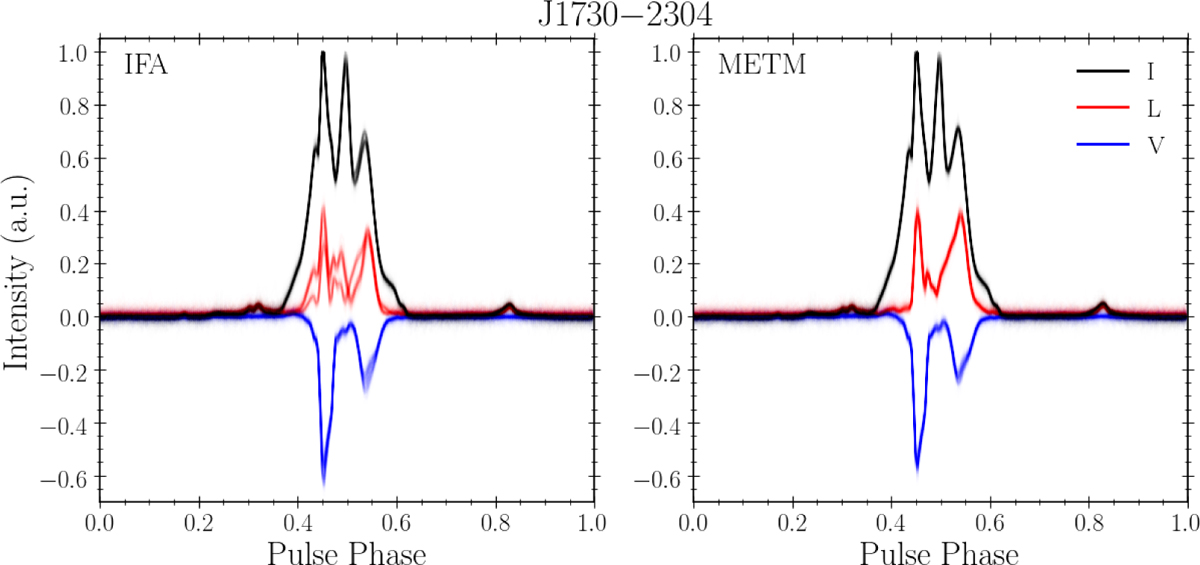
NUPPI polarimetric pulse profiles for PSR J1730-2304 at 1.4 GHz. The left panel shows the profiles obtained when calibrating the NUPPI data with the ideal feed assumption (IFA) method, and the right panel shows polarimetric profiles obtained with the calibration method presented in Sect. 3, based on the METM method of PSRCHIVE. The black, red, and blue lines respectively represent the total intensity (Stokes parameter I), the linear polarization (L), and the circular polarization (V). All NUPPI observations of J1730-2304 are shown, and were normalized to the maximum value of the total intensity (see Appendix A for additional details on the construction of this figure, and for the polarimetric profiles for the other analyzed MSPs).
Current usage metrics show cumulative count of Article Views (full-text article views including HTML views, PDF and ePub downloads, according to the available data) and Abstracts Views on Vision4Press platform.
Data correspond to usage on the plateform after 2015. The current usage metrics is available 48-96 hours after online publication and is updated daily on week days.
Initial download of the metrics may take a while.