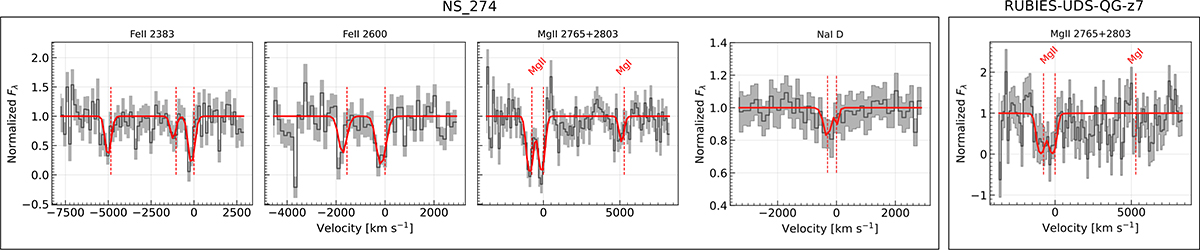
Fig. 6.
Download original image
Blueshifted absorption features. Left panels: Continuum-normalized spectrum (black line) and its uncertainties (gray line) around FeII, MgII+MgI, and NaI D lines for NS_274. Rightmost panel: G235M spectrum around MgII+MgI for RUBIES-UDS-QG-z7. The best-fit model with VOIGTFIT is marked by the solid red line. The systemic velocity for each line is marked by dashed red lines.
Current usage metrics show cumulative count of Article Views (full-text article views including HTML views, PDF and ePub downloads, according to the available data) and Abstracts Views on Vision4Press platform.
Data correspond to usage on the plateform after 2015. The current usage metrics is available 48-96 hours after online publication and is updated daily on week days.
Initial download of the metrics may take a while.