Fig. 6
Download original image
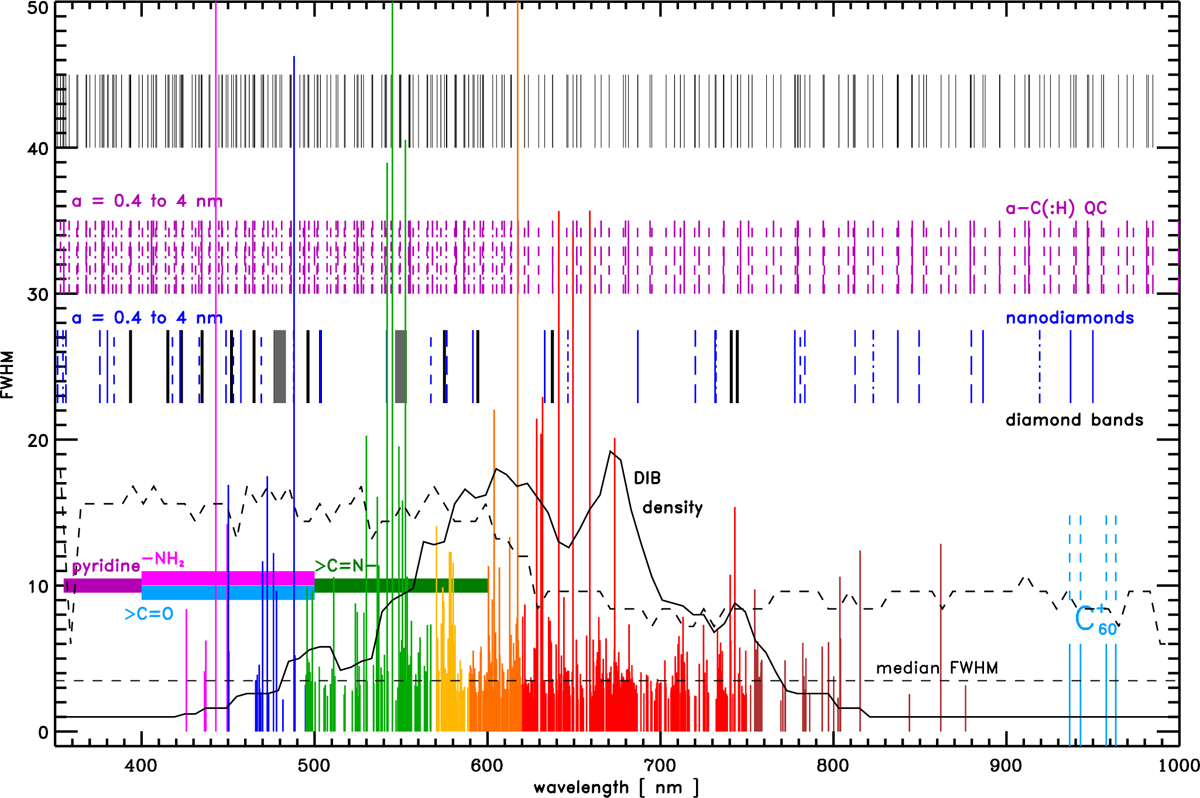
Set of over 550 DIB FWHMs and colours (coloured lines) as a function of wavelength taken from Fan et al. (2019). The cobalt blue lines indicate the ![]() DIBs (Campbell et al. 2015; Walker et al. 2015). The DIB density line schematically shows their number per unit wavelength interval and the dashed black line shows the same for the a-C(:H) particles. The short vertical blue lines indicate the QC transition bands for nanodiamond structures of Jones (2022) for transitions from the ground state to n = 2 to 5, shown with solid, long-dashed, short-dashed, and dash-dotted lines, respectively. Also shown in black are the positions of the bulk diamond optical impurity- and defect-related bands. The two wider dark grey bands indicate the broader bands at 480 and 550nm (see Table 3 in Jones & Ysard 2022, and references therein). The purple lines show the idealised a-C(:H) nanoparticle QC transition bands with the same line transition style key as for the nanodiamond bands. All modelled bands were calculated using Eqs. (10)–(13). The topmost thin black lines show, undifferentiated, the modelled and measured bands. The coloured, horizontal, wide bands indicate the CND emission bands for the indicated surface, O, and N heteroatom species.
DIBs (Campbell et al. 2015; Walker et al. 2015). The DIB density line schematically shows their number per unit wavelength interval and the dashed black line shows the same for the a-C(:H) particles. The short vertical blue lines indicate the QC transition bands for nanodiamond structures of Jones (2022) for transitions from the ground state to n = 2 to 5, shown with solid, long-dashed, short-dashed, and dash-dotted lines, respectively. Also shown in black are the positions of the bulk diamond optical impurity- and defect-related bands. The two wider dark grey bands indicate the broader bands at 480 and 550nm (see Table 3 in Jones & Ysard 2022, and references therein). The purple lines show the idealised a-C(:H) nanoparticle QC transition bands with the same line transition style key as for the nanodiamond bands. All modelled bands were calculated using Eqs. (10)–(13). The topmost thin black lines show, undifferentiated, the modelled and measured bands. The coloured, horizontal, wide bands indicate the CND emission bands for the indicated surface, O, and N heteroatom species.
Current usage metrics show cumulative count of Article Views (full-text article views including HTML views, PDF and ePub downloads, according to the available data) and Abstracts Views on Vision4Press platform.
Data correspond to usage on the plateform after 2015. The current usage metrics is available 48-96 hours after online publication and is updated daily on week days.
Initial download of the metrics may take a while.