Fig. 3
Download original image
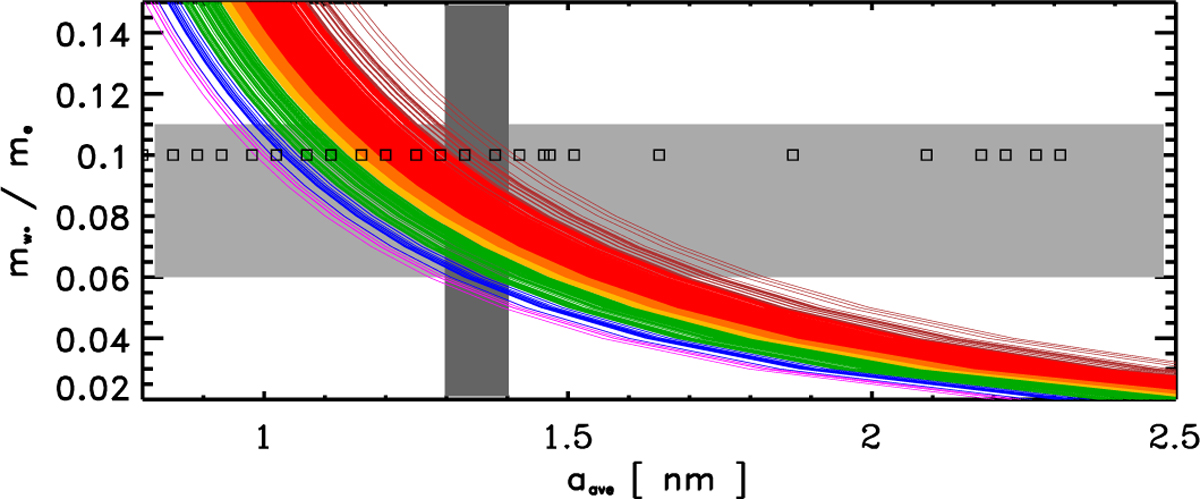
Product ![]() , derived from Eq. (13), for over 550 DIB wavelengths (Fan et al. 2019). The horizontal grey band shows typical values for the effective carrier masses (
, derived from Eq. (13), for over 550 DIB wavelengths (Fan et al. 2019). The horizontal grey band shows typical values for the effective carrier masses (![]() ). The squares indicate the radii of the diamond network particles (Jones 2022, see Sect. 4) for
). The squares indicate the radii of the diamond network particles (Jones 2022, see Sect. 4) for ![]() . The vertical dark grey band marks the mean radius range for pre-solar nanodiamonds.
. The vertical dark grey band marks the mean radius range for pre-solar nanodiamonds.
Current usage metrics show cumulative count of Article Views (full-text article views including HTML views, PDF and ePub downloads, according to the available data) and Abstracts Views on Vision4Press platform.
Data correspond to usage on the plateform after 2015. The current usage metrics is available 48-96 hours after online publication and is updated daily on week days.
Initial download of the metrics may take a while.