Fig. C.1
Download original image
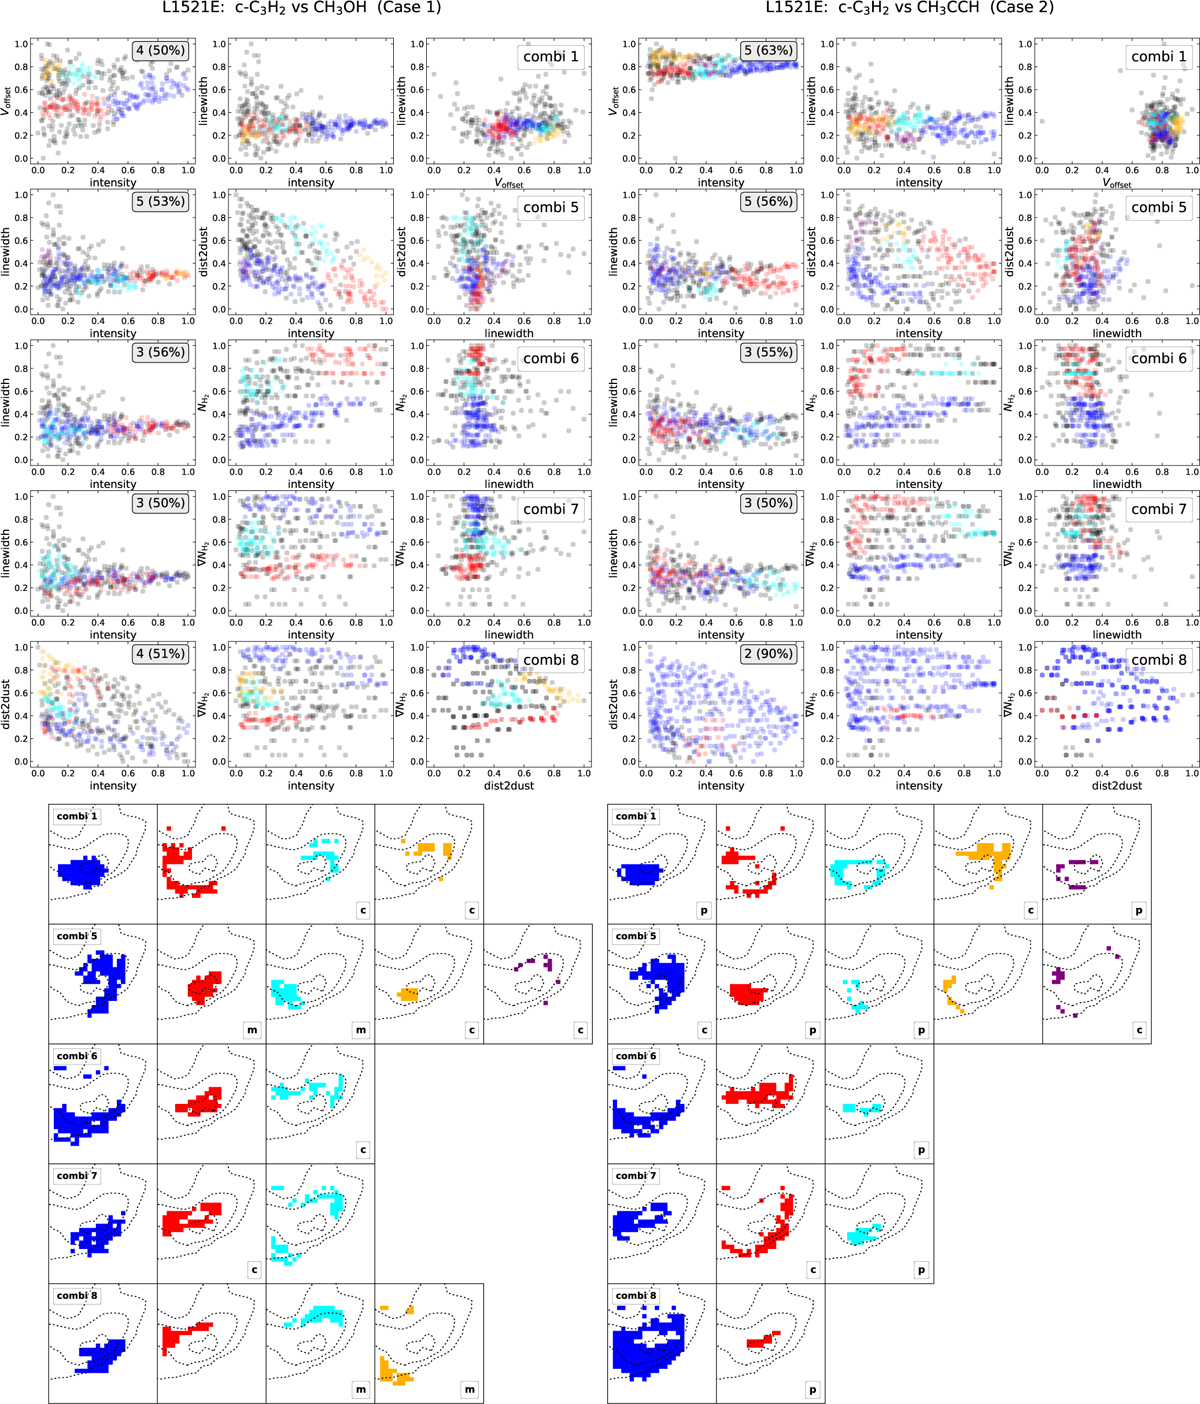
Clustering results for the starless core L1521E for the dataset of Case 1 (left) and the dataset of Case 2 (right), for feature combinations 2, 3, 4, 9, and 10. Each row represents a different combination of features (see Table. 3): combination 2 (intensity, Voffset, and dist2dust), combination 3 (intensity, Voffset, and ![]() ), combination 4 (intensity, Voffset, and
), combination 4 (intensity, Voffset, and ![]() ), combination 9 (intensity, dist2dust, and
), combination 9 (intensity, dist2dust, and ![]() ), and combination 10 (intensity,
), and combination 10 (intensity, ![]() ,
, ![]() ). Top : Distribution of the resulting clusters in the input features. The annotations provide information on how many clusters were found by the algorithm (two to five) and what percentage of data points are assigned to the clusters. Noise points (=points not assigned to any cluster) are plotted in black. The colours of the clusters are ordered by cluster size: the biggest cluster is given in blue, followed by red, cyan, yellow, and purple. Bottom: Corresponding spatial distribution of each cluster across the core. The annotations indicate if a cluster contains more than 60% of one molecule (c: c-C3H2; m: CH3OH; p: CH3CCH). The dashed line contours represent 30%, 50%, 90% of the H2 column density peak derived from Herschel maps Spezzano et al. (2020).
). Top : Distribution of the resulting clusters in the input features. The annotations provide information on how many clusters were found by the algorithm (two to five) and what percentage of data points are assigned to the clusters. Noise points (=points not assigned to any cluster) are plotted in black. The colours of the clusters are ordered by cluster size: the biggest cluster is given in blue, followed by red, cyan, yellow, and purple. Bottom: Corresponding spatial distribution of each cluster across the core. The annotations indicate if a cluster contains more than 60% of one molecule (c: c-C3H2; m: CH3OH; p: CH3CCH). The dashed line contours represent 30%, 50%, 90% of the H2 column density peak derived from Herschel maps Spezzano et al. (2020).
Current usage metrics show cumulative count of Article Views (full-text article views including HTML views, PDF and ePub downloads, according to the available data) and Abstracts Views on Vision4Press platform.
Data correspond to usage on the plateform after 2015. The current usage metrics is available 48-96 hours after online publication and is updated daily on week days.
Initial download of the metrics may take a while.