Fig. A.2
Download original image
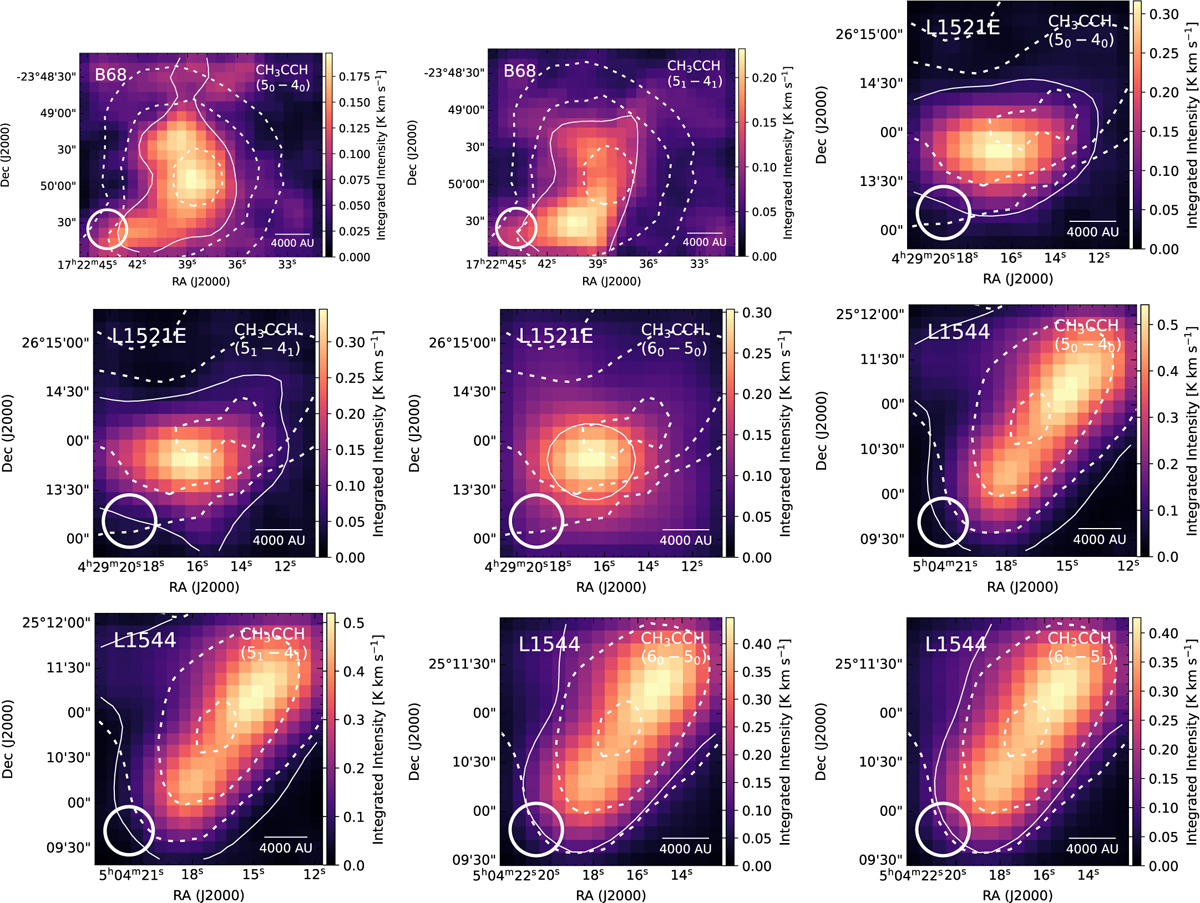
Integrated intensity maps of CH3 CCH observed towards B68, L1521E (Nagy et al. 2019), and L1544 (Spezzano et al. 2017). The solid line contours indicate the 3σ level of the integrated intensity for B68 and L1521E, and the 6σ level for L1544. The dashed line contours represent 90%, 50%, and 30% of the H2 column density peak derived from Herschel maps (Spezzano et al. 2020). The white circle in the bottom-left corner indicates the beam size of the IRAM 30m telescope (32").
Current usage metrics show cumulative count of Article Views (full-text article views including HTML views, PDF and ePub downloads, according to the available data) and Abstracts Views on Vision4Press platform.
Data correspond to usage on the plateform after 2015. The current usage metrics is available 48-96 hours after online publication and is updated daily on week days.
Initial download of the metrics may take a while.