Fig. 8
Download original image
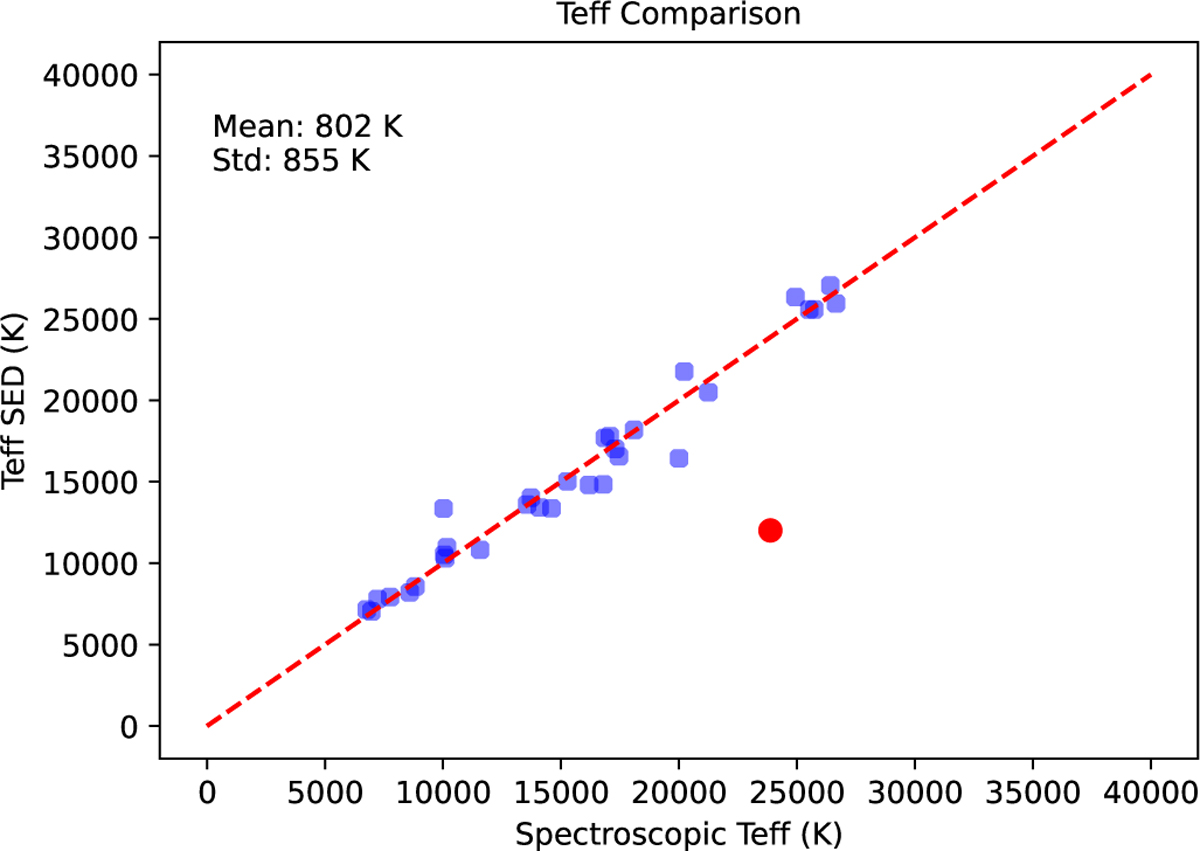
Comparison plot between Teff derived from the single-DA SED fitting and those obtained from previous spectral fitting. The red point in the plot represents the outlier WDJ100236.84+023835.03 with significantly inconsistent temperatures, as is discussed in Section 6.1. Ignoring this outlier, the spectroscopic temperatures differ from the photometric temperatures by a mean difference of 802 K, with a standard deviation of 855 K.
Current usage metrics show cumulative count of Article Views (full-text article views including HTML views, PDF and ePub downloads, according to the available data) and Abstracts Views on Vision4Press platform.
Data correspond to usage on the plateform after 2015. The current usage metrics is available 48-96 hours after online publication and is updated daily on week days.
Initial download of the metrics may take a while.