Fig. 5
Download original image
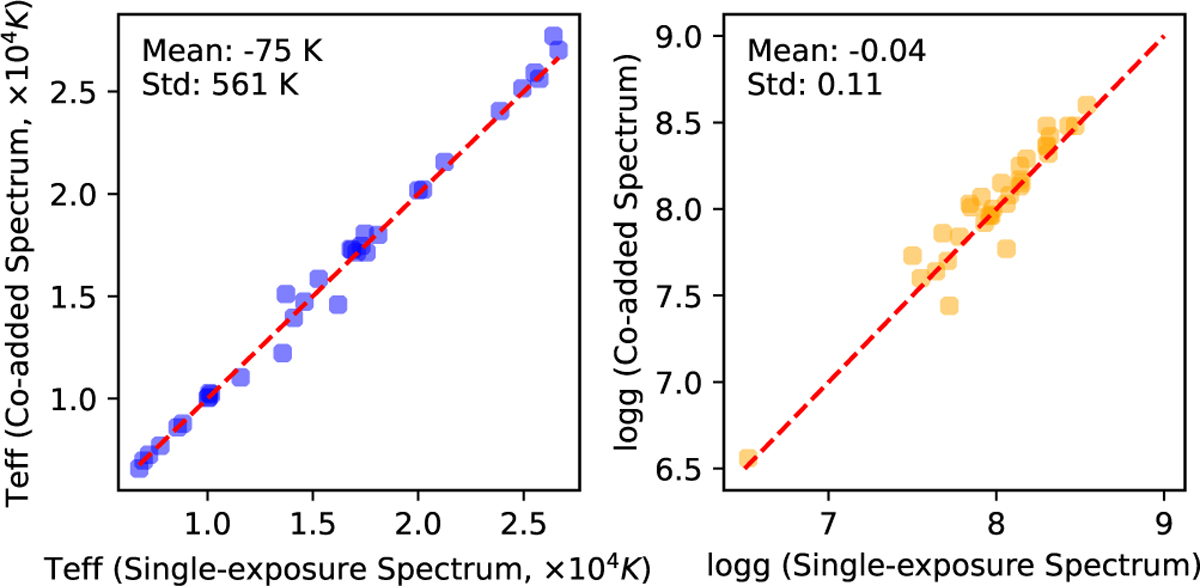
Comparison plots between single-exposure spectra and coadded spectra. The parameters of single-exposure spectra are the weighted average of Teff and log g obtained from each single-exposure spectrum, using the S/N as the weight. The parameters of coadded spectra are from wdtools fitting. The left panel shows Teff, while the right panel displays log g. And Teff shows a mean difference of −75 K with a standard deviation of 561 K, while log g has a mean difference of −0.04 and a standard deviation of 0.11.
Current usage metrics show cumulative count of Article Views (full-text article views including HTML views, PDF and ePub downloads, according to the available data) and Abstracts Views on Vision4Press platform.
Data correspond to usage on the plateform after 2015. The current usage metrics is available 48-96 hours after online publication and is updated daily on week days.
Initial download of the metrics may take a while.