Fig. 2
Download original image
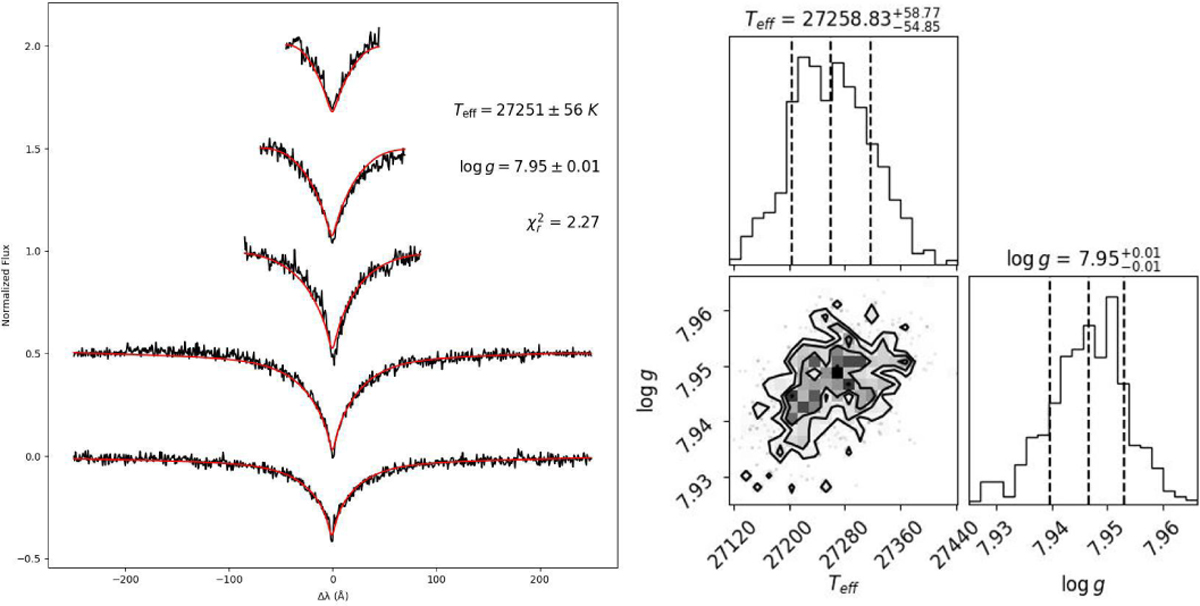
Fitting and corner plot from wdtools. The left panel shows the fitting result of the hydrogen Balmer lines (Hα, Hβ, Hγ, Hδ, and Hϵ, from bottom to top) for the single-exposure spectrum of WDJ084253.03+230025.47 at MJD = 59230.347393, yielding Teff and log g. The right panel is the corresponding corner plot, which illustrates the correlations between parameters and their marginal distributions, providing a visual representation of parameter uncertainties.
Current usage metrics show cumulative count of Article Views (full-text article views including HTML views, PDF and ePub downloads, according to the available data) and Abstracts Views on Vision4Press platform.
Data correspond to usage on the plateform after 2015. The current usage metrics is available 48-96 hours after online publication and is updated daily on week days.
Initial download of the metrics may take a while.