Open Access
Fig. 14
Download original image
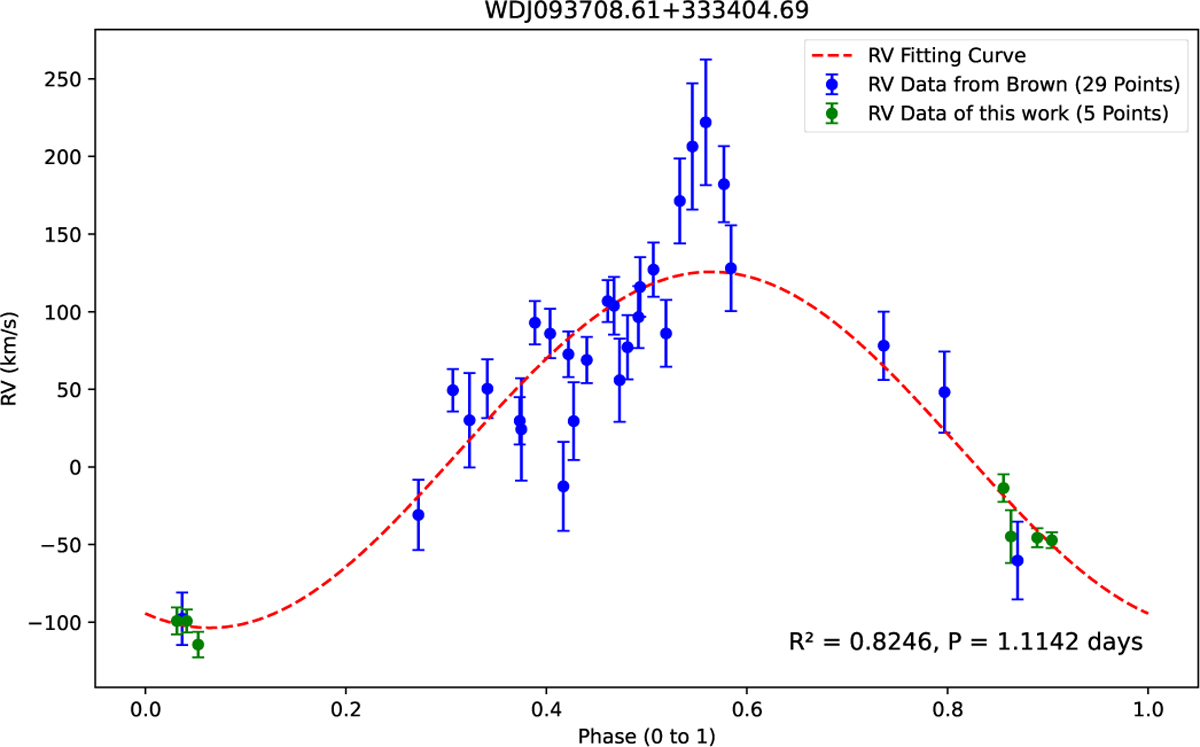
RV fitting curve of WDJ093708.61+333404.69. The green points represent the RV data we calculated, while the blue points are from Brown et al. (2011). The period is 1.114167 days, consistent with the 1.1142-day period given by Brown et al. (2011), but the fit is suboptimal, with many outliers and an R2 of only 0.82.
Current usage metrics show cumulative count of Article Views (full-text article views including HTML views, PDF and ePub downloads, according to the available data) and Abstracts Views on Vision4Press platform.
Data correspond to usage on the plateform after 2015. The current usage metrics is available 48-96 hours after online publication and is updated daily on week days.
Initial download of the metrics may take a while.