Open Access
Fig. 11
Download original image
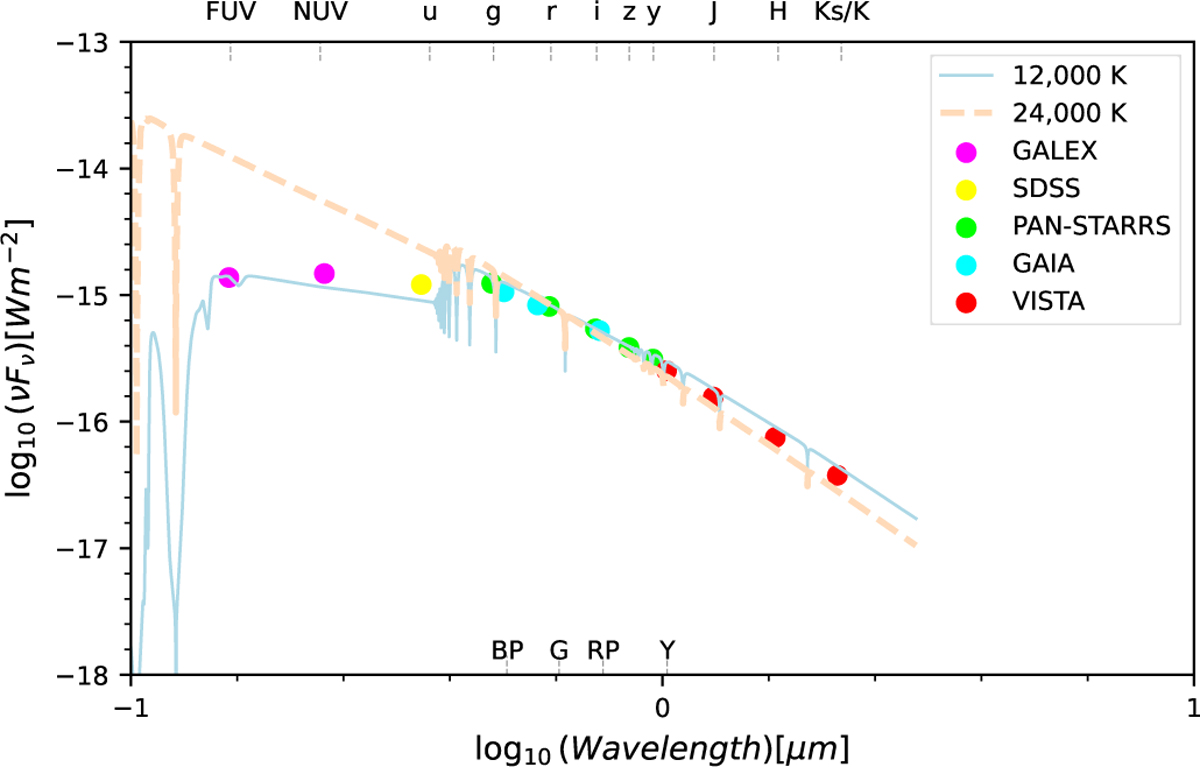
SED fitting plot for WDJ100236.84+023835.03. The light blue curve represents the SED at about 12 000 K, while the light orange curve corresponds to about 24 000 K. In the FUV and NUV bands, the high-temperature curve is significantly higher than the observed data points.
Current usage metrics show cumulative count of Article Views (full-text article views including HTML views, PDF and ePub downloads, according to the available data) and Abstracts Views on Vision4Press platform.
Data correspond to usage on the plateform after 2015. The current usage metrics is available 48-96 hours after online publication and is updated daily on week days.
Initial download of the metrics may take a while.