Open Access
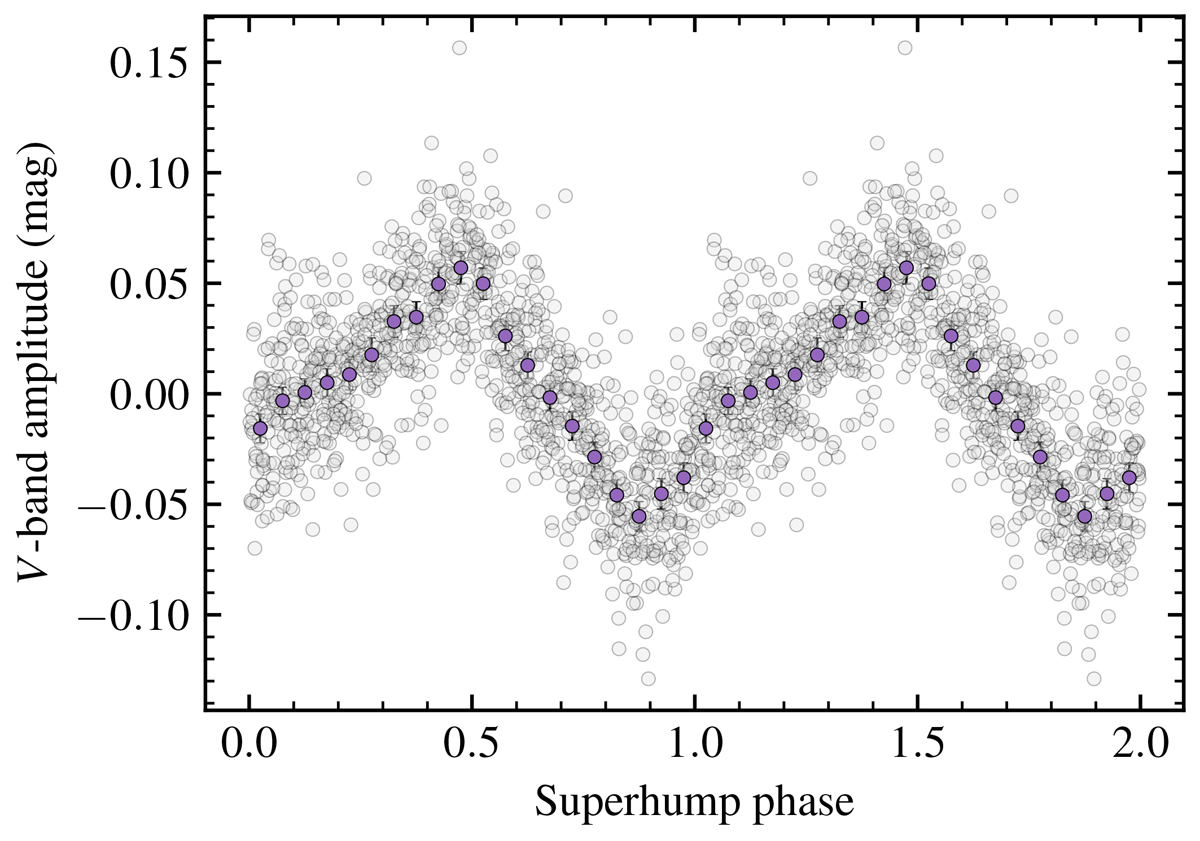
Fig. 9.
Download original image
Phase-averaged light curves from AAVSO observers between days 16 and 18 that reveal the profile of the observed superhumps close to their maximum amplitude. The phase is given arbitrarily relative to discovery date because measure of when the superhumps first emerged is not precise.
Current usage metrics show cumulative count of Article Views (full-text article views including HTML views, PDF and ePub downloads, according to the available data) and Abstracts Views on Vision4Press platform.
Data correspond to usage on the plateform after 2015. The current usage metrics is available 48-96 hours after online publication and is updated daily on week days.
Initial download of the metrics may take a while.