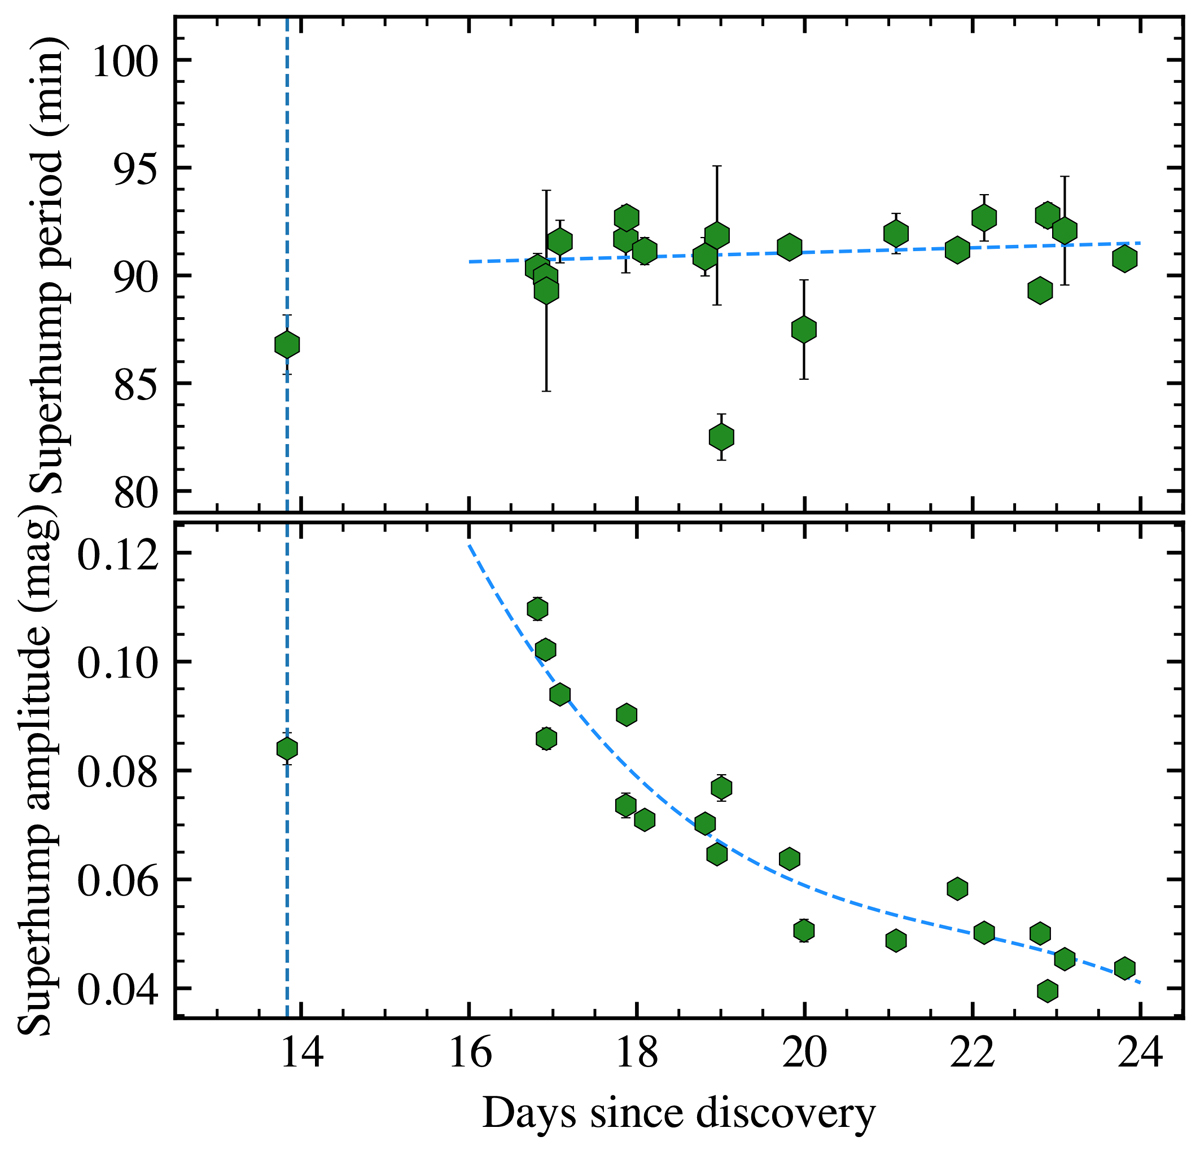
Fig. 8.
Download original image
Superhump period and amplitude evolution in GOTO0650. The time is given relative to the GOTO discovery date. The dashed blue line indicates the first epoch at which superhumps were detected. The error bars in both plots are the 1σ statistical uncertainties. An illustrative fit to the superhump period and amplitude is overplotted to show the overall evolution.
Current usage metrics show cumulative count of Article Views (full-text article views including HTML views, PDF and ePub downloads, according to the available data) and Abstracts Views on Vision4Press platform.
Data correspond to usage on the plateform after 2015. The current usage metrics is available 48-96 hours after online publication and is updated daily on week days.
Initial download of the metrics may take a while.