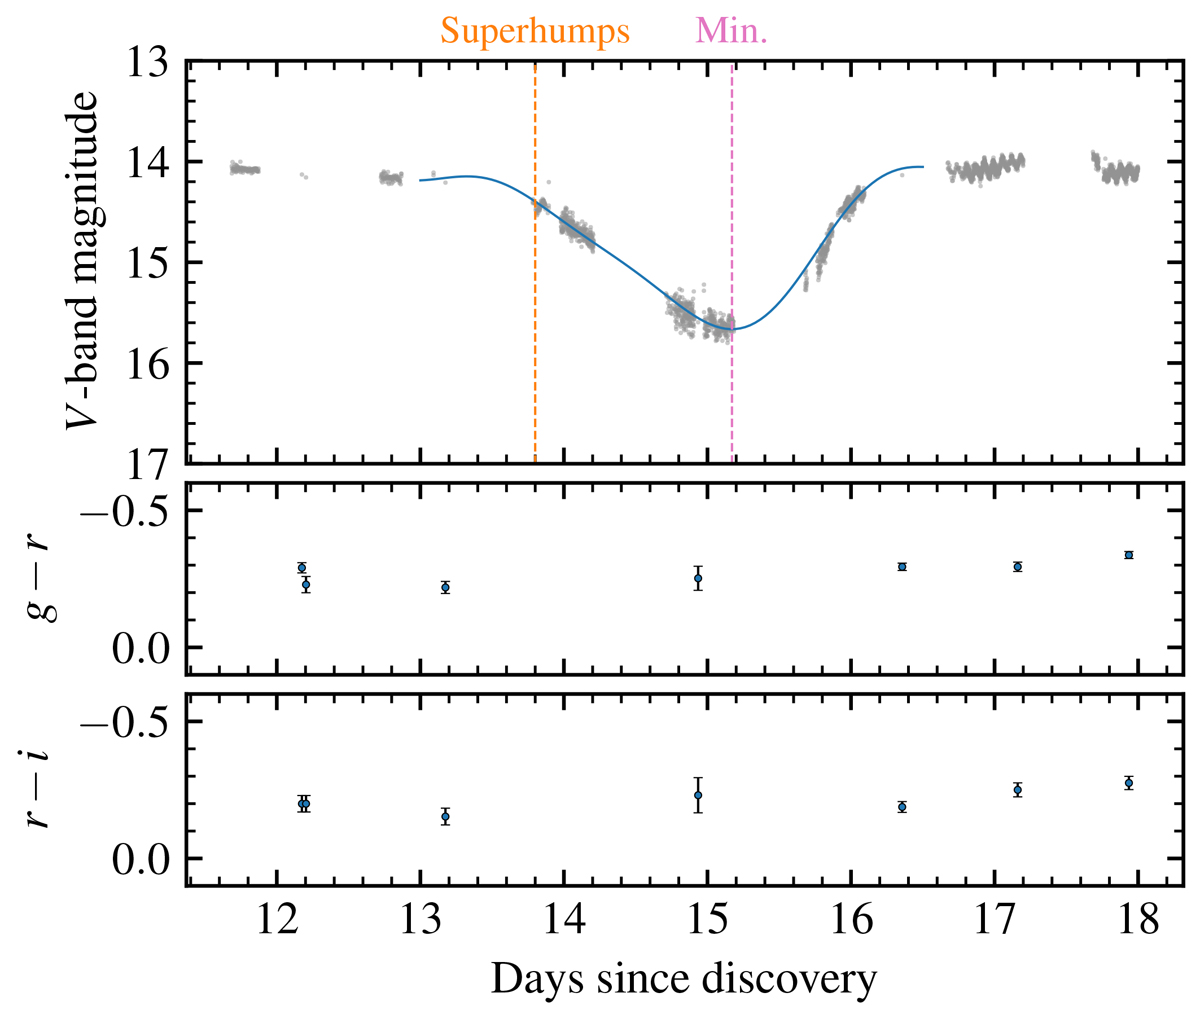
Fig. 6.
Download original image
High-cadence V-band photometry around the dip observed in GOTO0650 from AAVSO, LCO, pt5m, and TTT. The blue curve shows a spline interpolation of the data. The vertical dashed line shows the initial onset of superhumps as the dip began. The g−r and r−i colour indices show no significant evolution through the dip. The dip shows a marked asymmetry, with a slow ingress and rapid egress. High-amplitude superhumps with an amplitude of ≈0.1 mag are visible immediately after the dip.
Current usage metrics show cumulative count of Article Views (full-text article views including HTML views, PDF and ePub downloads, according to the available data) and Abstracts Views on Vision4Press platform.
Data correspond to usage on the plateform after 2015. The current usage metrics is available 48-96 hours after online publication and is updated daily on week days.
Initial download of the metrics may take a while.