Open Access
Fig. 4.
Download original image
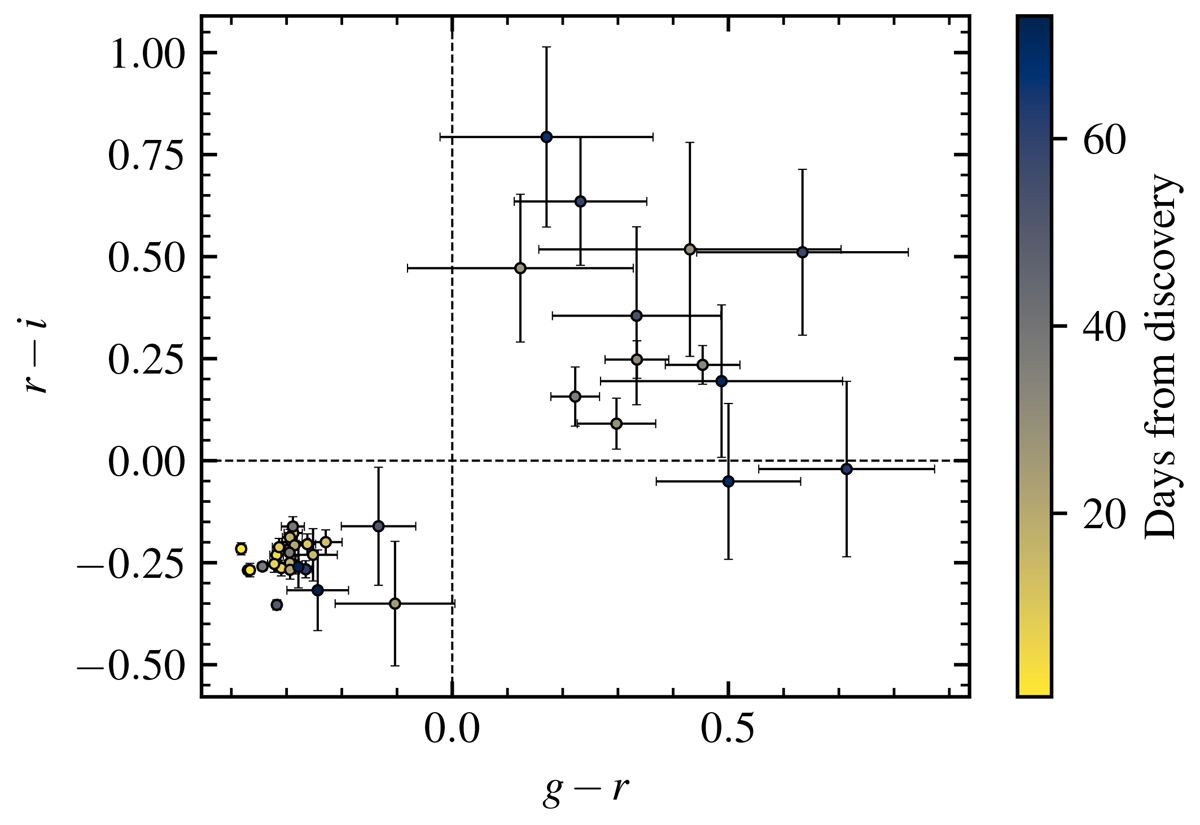
Colour locus plot of GOTO0650 from LCO and TTT gri photometry, showing the distinct two clusters corresponding to the high and low state. The points are shaded to show the phase relative to discovery.
Current usage metrics show cumulative count of Article Views (full-text article views including HTML views, PDF and ePub downloads, according to the available data) and Abstracts Views on Vision4Press platform.
Data correspond to usage on the plateform after 2015. The current usage metrics is available 48-96 hours after online publication and is updated daily on week days.
Initial download of the metrics may take a while.