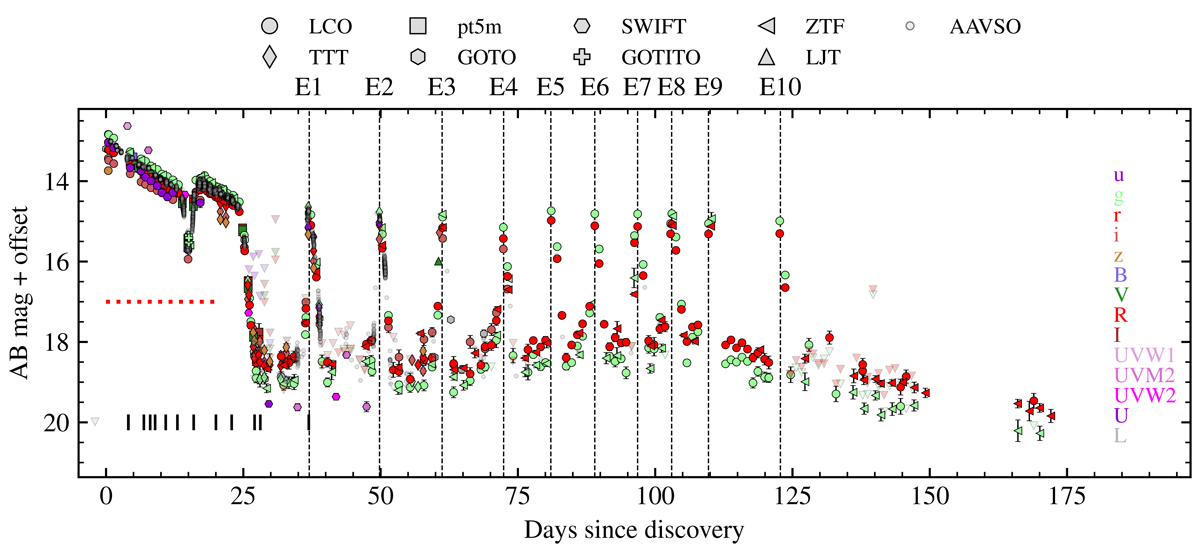
Fig. 3.
Download original image
Collated photometry of GOTO0650 (see Table 1), shown relative to the GOTO discovery epoch. An overview of this photometry and the associated uncertainties is presented in Table A.1. The error bars are typically too small to be seen. The photometry was corrected for Galactic extinction. The vertical markers indicate phases in which the spectra were obtained. Non-detections are overplotted with the triangular markers where available, corresponding to 5σ upper limits, with the opacity facilitating visualisation in areas of dense coverage. The vertical lines annotated EN correspond to the Nth echo outburst observed, and the dotted red line indicates the magnitude at which we distinguish between high and low states.
Current usage metrics show cumulative count of Article Views (full-text article views including HTML views, PDF and ePub downloads, according to the available data) and Abstracts Views on Vision4Press platform.
Data correspond to usage on the plateform after 2015. The current usage metrics is available 48-96 hours after online publication and is updated daily on week days.
Initial download of the metrics may take a while.