Fig. 13.
Download original image
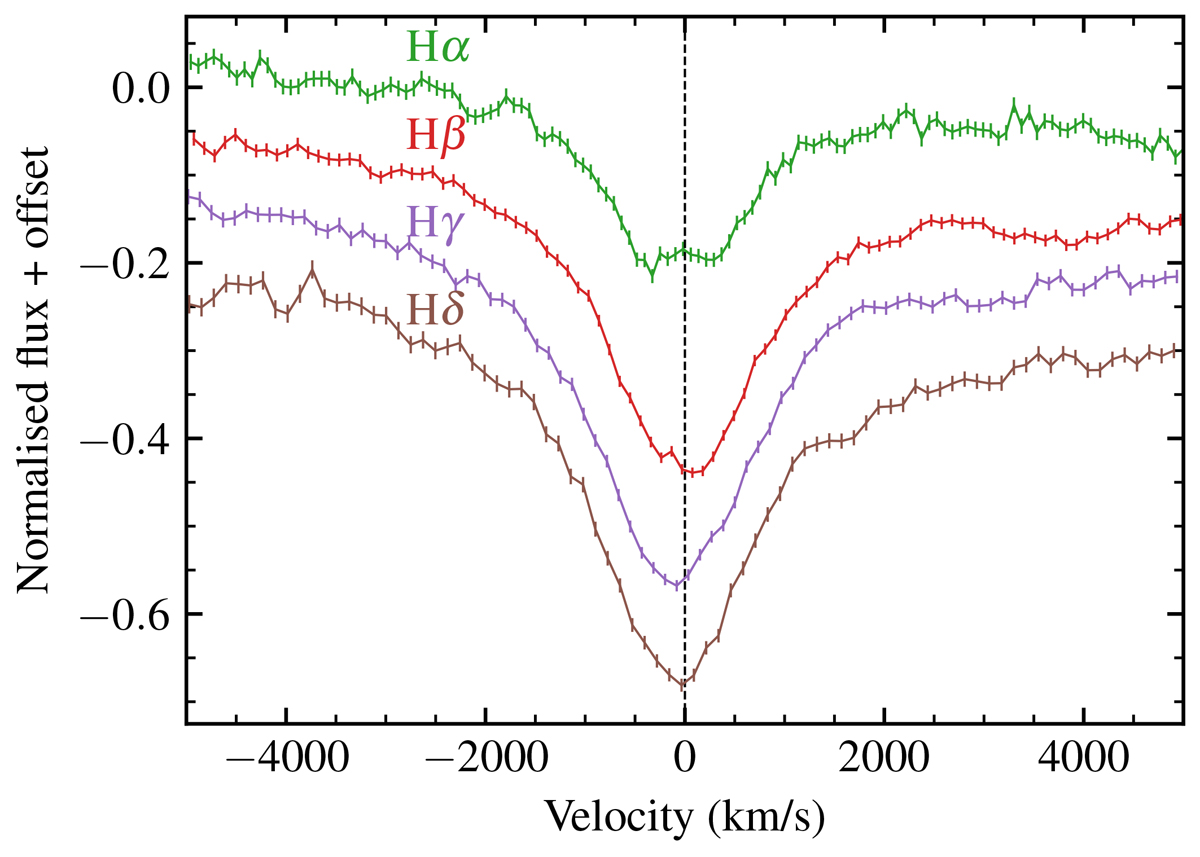
Balmer lines as observed in the +36 d spectrum obtained at the peak of the first echo outburst. There are clear differences between the line profiles moving to higher ionisation lines, and the varying line profiles are well explained by the differences in amplitude between the Balmer emission seen in the low-state spectrum obtained on 28 d.
Current usage metrics show cumulative count of Article Views (full-text article views including HTML views, PDF and ePub downloads, according to the available data) and Abstracts Views on Vision4Press platform.
Data correspond to usage on the plateform after 2015. The current usage metrics is available 48-96 hours after online publication and is updated daily on week days.
Initial download of the metrics may take a while.