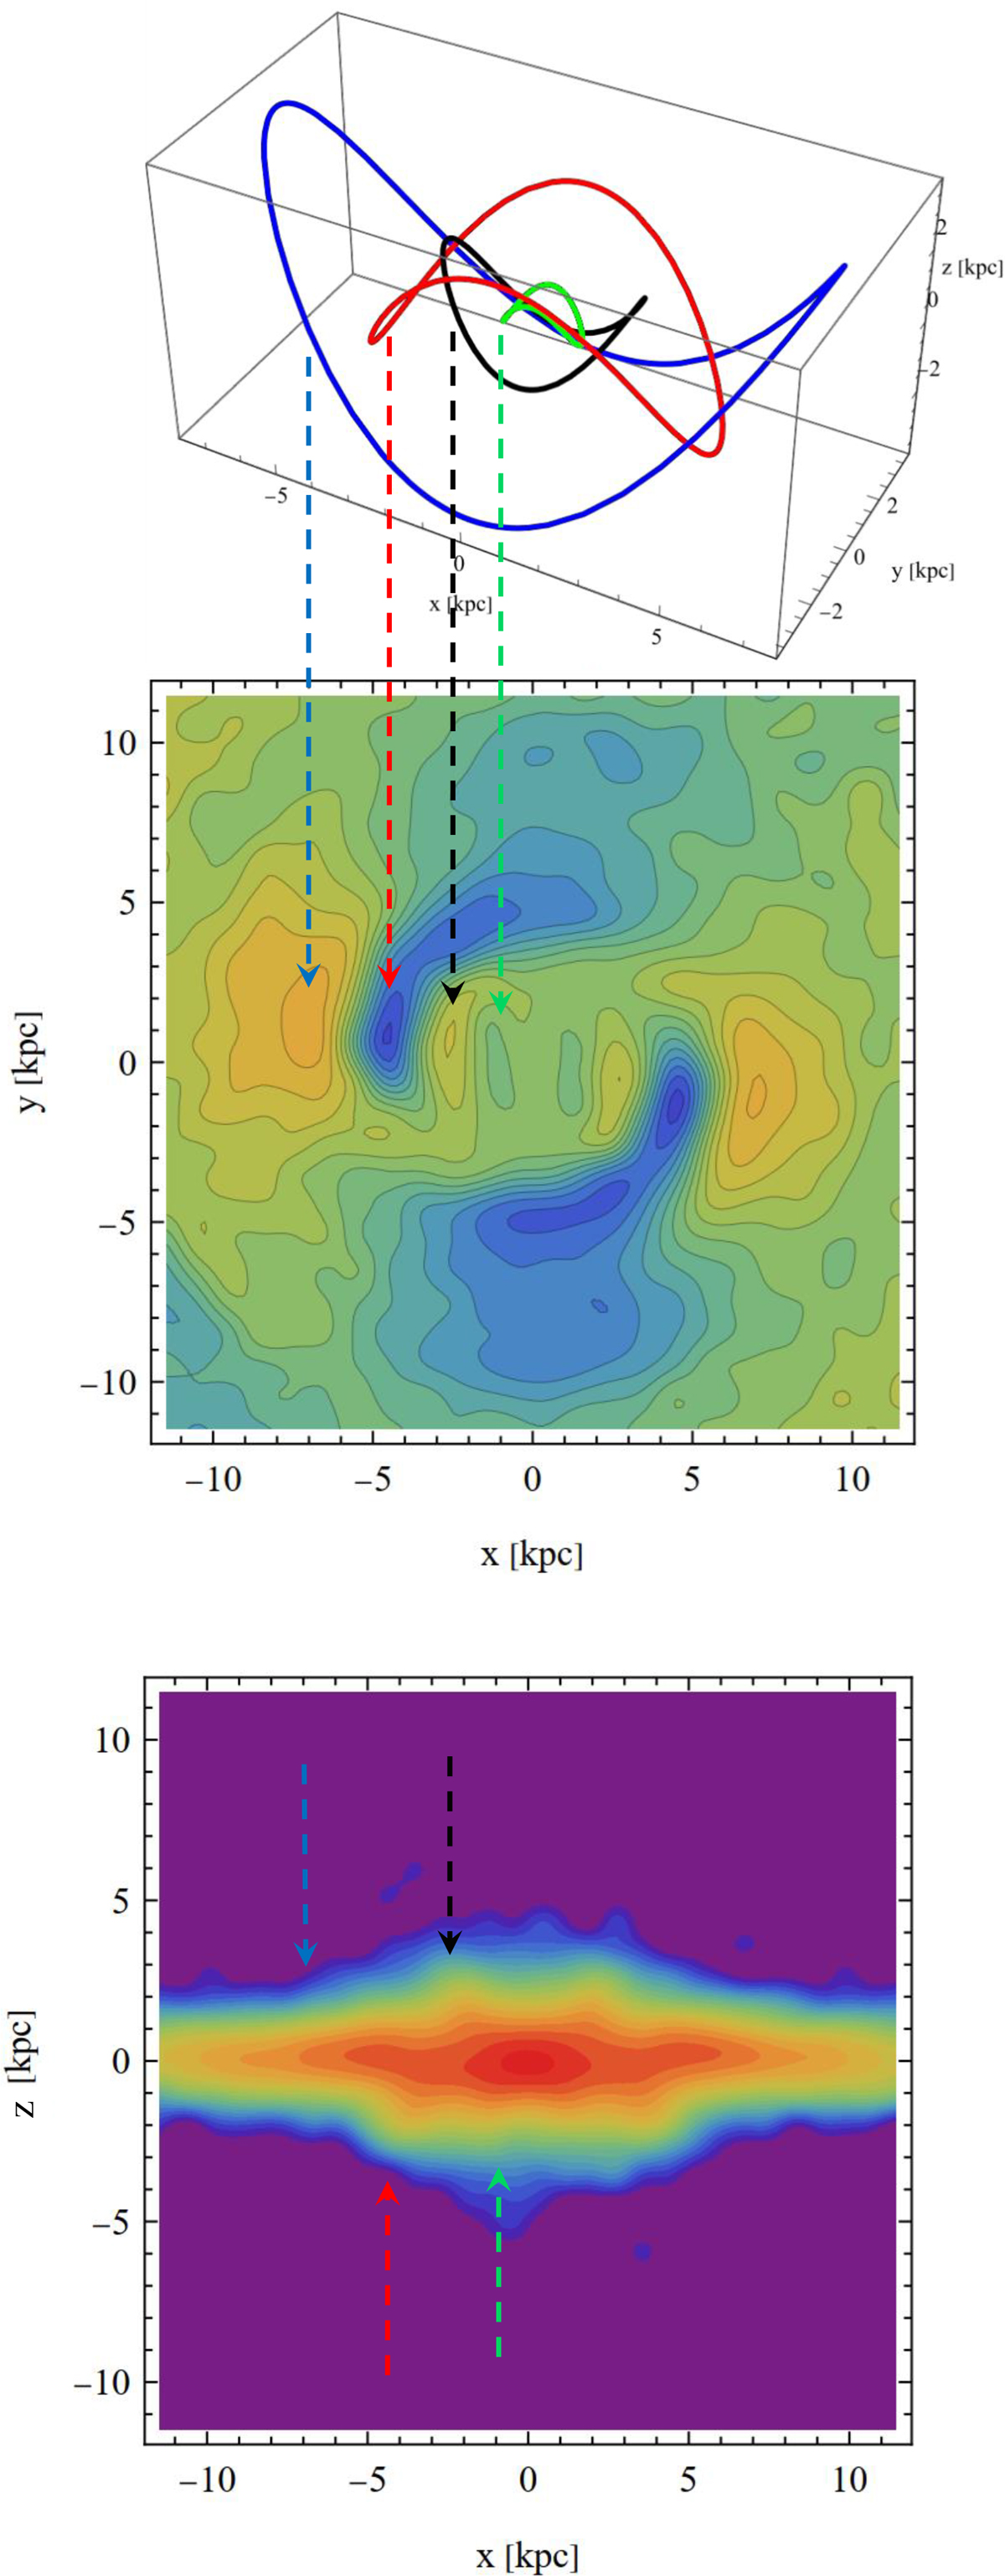
Fig. 9.
Download original image
Configuration leading to distortion seen in map of average positions of stars along vertical direction (middle panel) and in surface density of stellar component seen edge-on (along y, lower panel) for one selected time, t = 4.85 Gyr. The dashed arrows indicate the correspondence between the distortions rotated by the bending wave differently at different radii and the maxima and minima of the distributions of the stars in the face-on position map and edge-on density map.
Current usage metrics show cumulative count of Article Views (full-text article views including HTML views, PDF and ePub downloads, according to the available data) and Abstracts Views on Vision4Press platform.
Data correspond to usage on the plateform after 2015. The current usage metrics is available 48-96 hours after online publication and is updated daily on week days.
Initial download of the metrics may take a while.