Fig. 4.
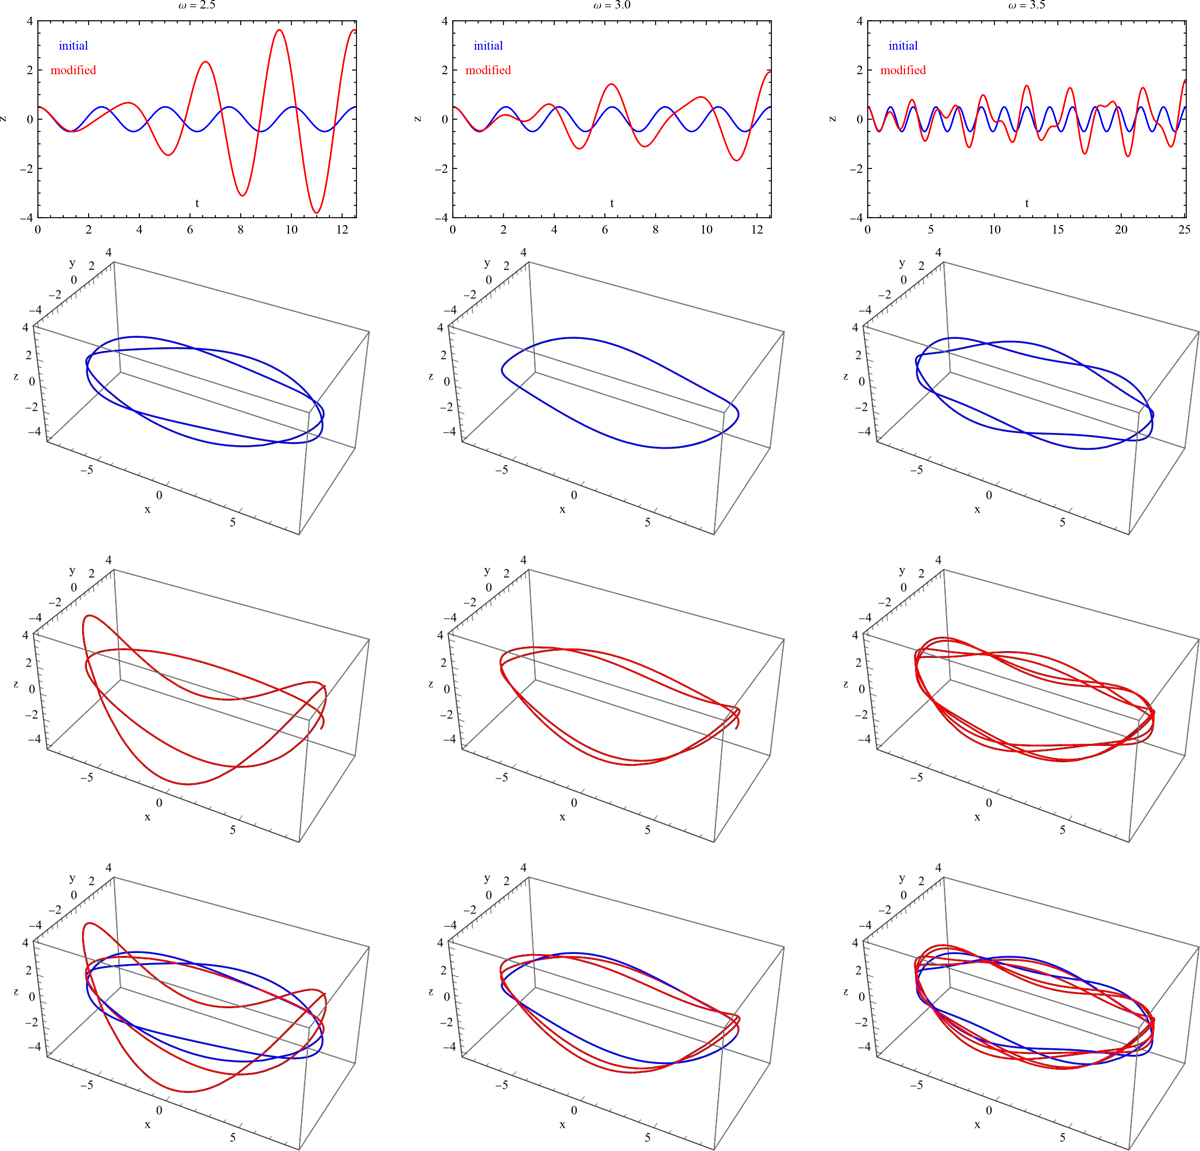
Download original image
Reaching resonance. The three columns show three examples of the evolution of stellar orbits under the growing force due to the distortion for different values of the initial frequency: ω = 2.5, 3, and 3.5. The solutions to Equation (2) were obtained with the force parameters F0 = 10 and α = 0.1 in all cases. The blue lines correspond to the initial oscillations and orbits, while the red lines show the modified ones. The panels of the upper row show the variation of the vertical position of the star along the orbit, while the next rows show the full orbits combining the motion along z with an ellipse in the xy plane without (blue, second row) and with (red, third row) the action of the force and the two combined (lower row).
Current usage metrics show cumulative count of Article Views (full-text article views including HTML views, PDF and ePub downloads, according to the available data) and Abstracts Views on Vision4Press platform.
Data correspond to usage on the plateform after 2015. The current usage metrics is available 48-96 hours after online publication and is updated daily on week days.
Initial download of the metrics may take a while.