Open Access
Fig. 3.
Download original image
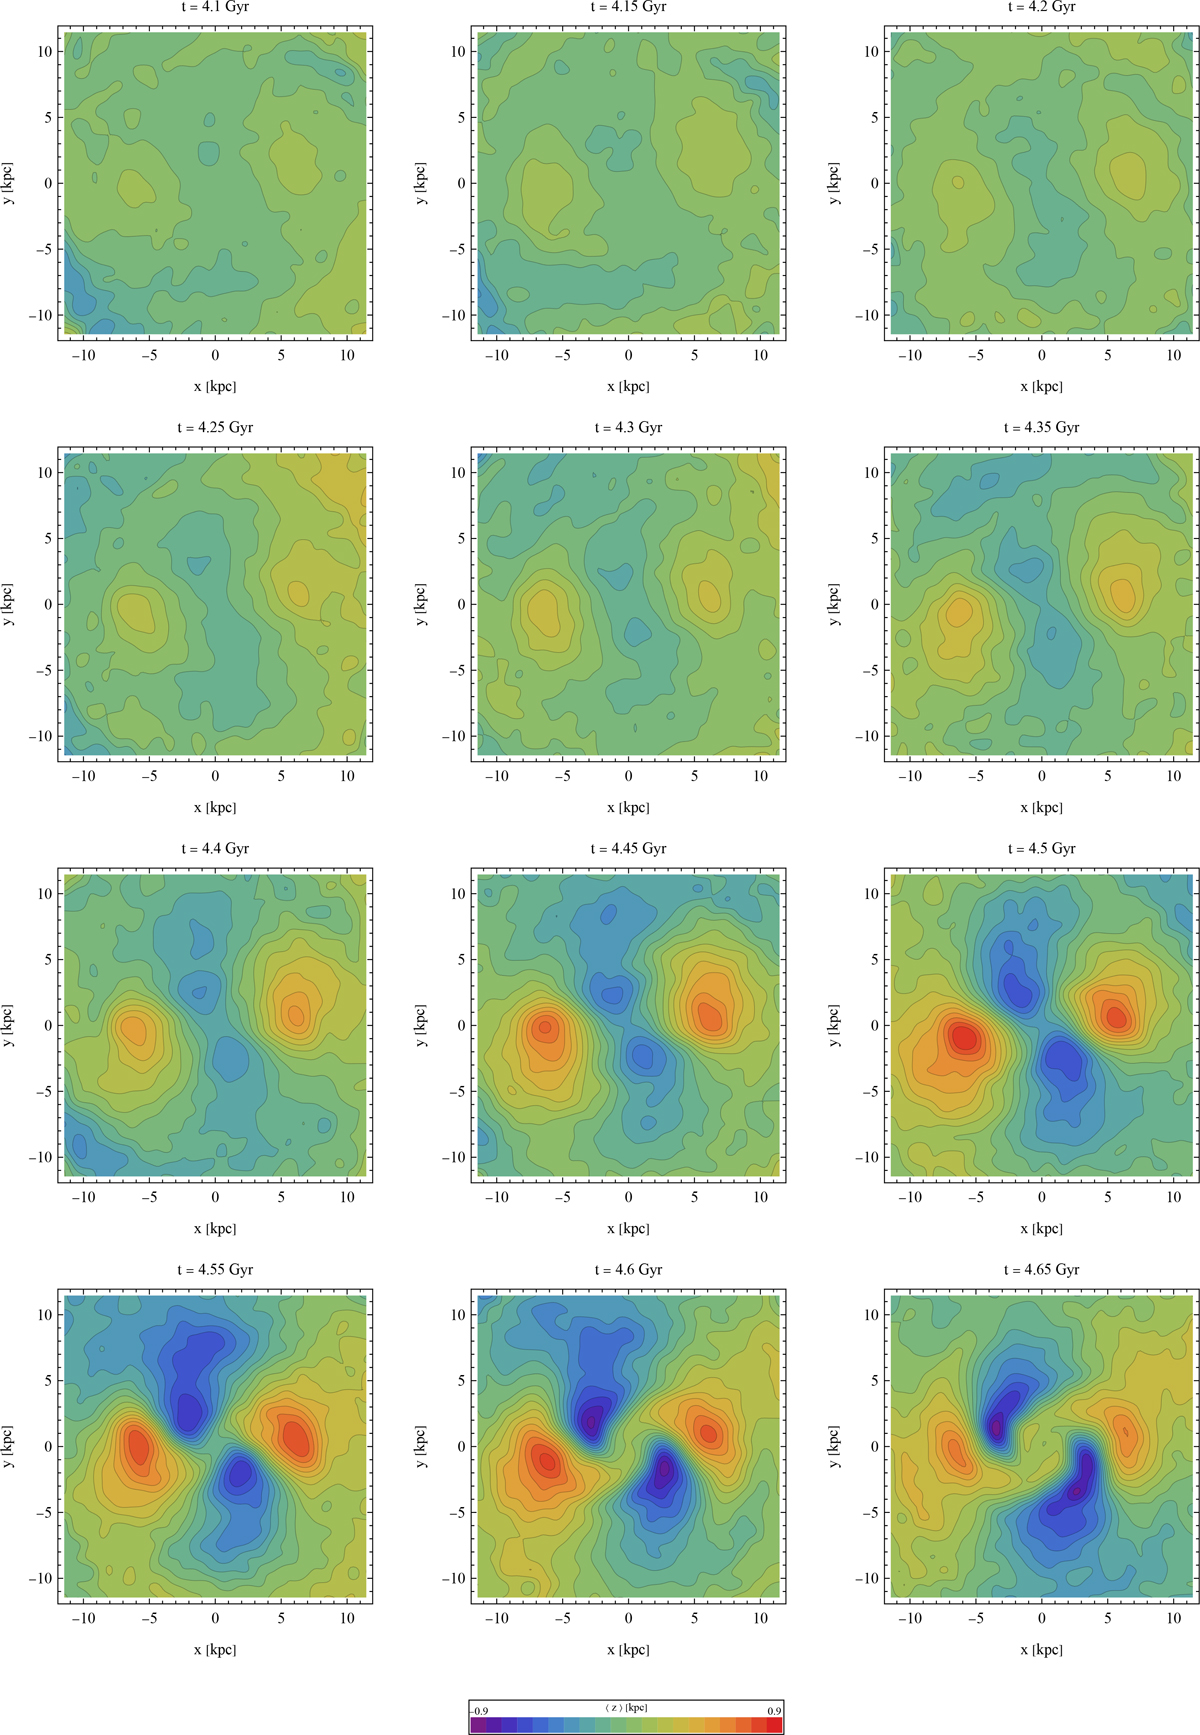
Average position of stars along vertical direction at times t = 4.1 to 4.65 Gyr from the start of the simulation. Redder colors indicate the distortion above the disk plane, and the bluer ones show the distortion below it. The maps show the measurements in the reference frame of the bar, which is oriented along the x-axis.
Current usage metrics show cumulative count of Article Views (full-text article views including HTML views, PDF and ePub downloads, according to the available data) and Abstracts Views on Vision4Press platform.
Data correspond to usage on the plateform after 2015. The current usage metrics is available 48-96 hours after online publication and is updated daily on week days.
Initial download of the metrics may take a while.