Fig. 11.
Download original image
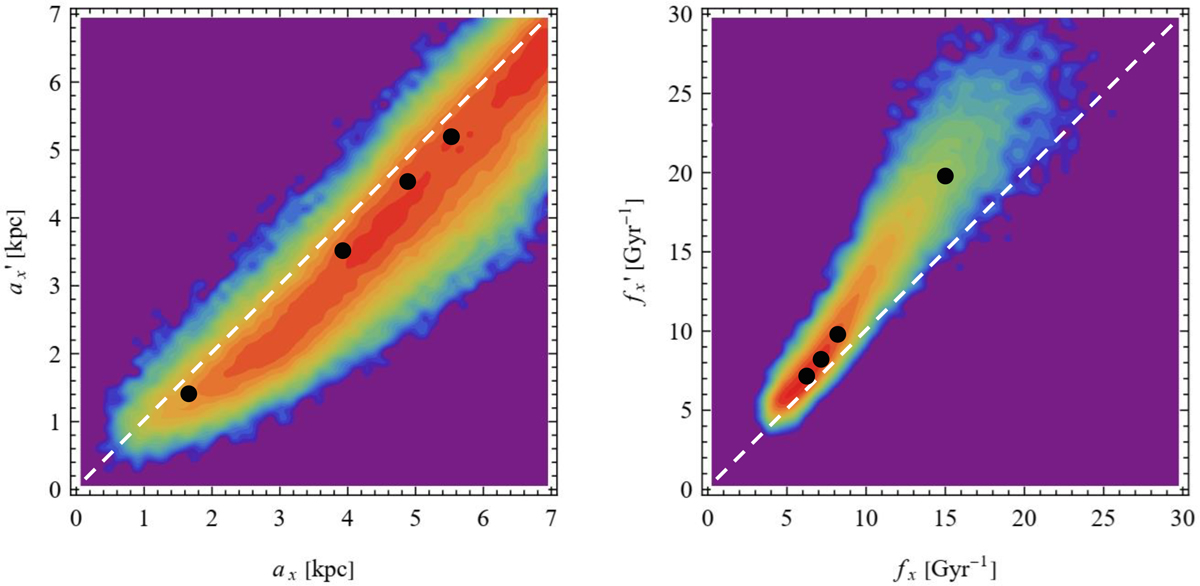
Relations between amplitudes of oscillations along bar (left panel) and their frequencies (right panel) before and after buckling. White dashed lines indicate equality between the measured values and the black points mark the values corresponding to the first four orbits shown in Fig. 12, with properties listed in the first four rows of Table 1.
Current usage metrics show cumulative count of Article Views (full-text article views including HTML views, PDF and ePub downloads, according to the available data) and Abstracts Views on Vision4Press platform.
Data correspond to usage on the plateform after 2015. The current usage metrics is available 48-96 hours after online publication and is updated daily on week days.
Initial download of the metrics may take a while.