Fig. 7
Download original image
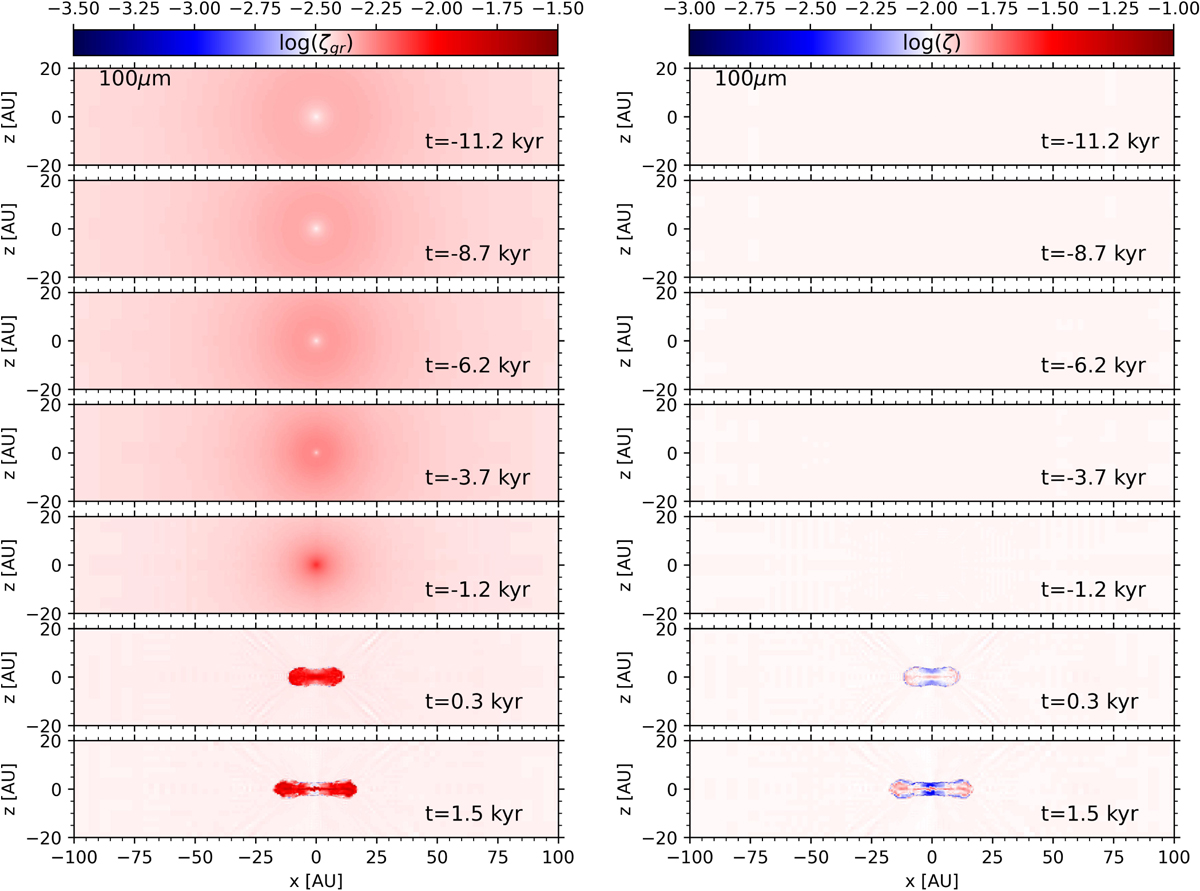
Time evolution of the grown dust-to-gas mass ratio ζgr and the total dust-to-gas mass ratio ζ in the x − z slice for the ![]() = 100 μm model. The left and right groups of panels show ζgr and ζ, respectively. White color indicates the initial value of log ζgr = −2.51 and shades of red correspond to dust enhancements. Time is measured from the disk formation epoch, which occurs 193 kyr after the onset of the simulations.
= 100 μm model. The left and right groups of panels show ζgr and ζ, respectively. White color indicates the initial value of log ζgr = −2.51 and shades of red correspond to dust enhancements. Time is measured from the disk formation epoch, which occurs 193 kyr after the onset of the simulations.
Current usage metrics show cumulative count of Article Views (full-text article views including HTML views, PDF and ePub downloads, according to the available data) and Abstracts Views on Vision4Press platform.
Data correspond to usage on the plateform after 2015. The current usage metrics is available 48-96 hours after online publication and is updated daily on week days.
Initial download of the metrics may take a while.