Fig. 3
Download original image
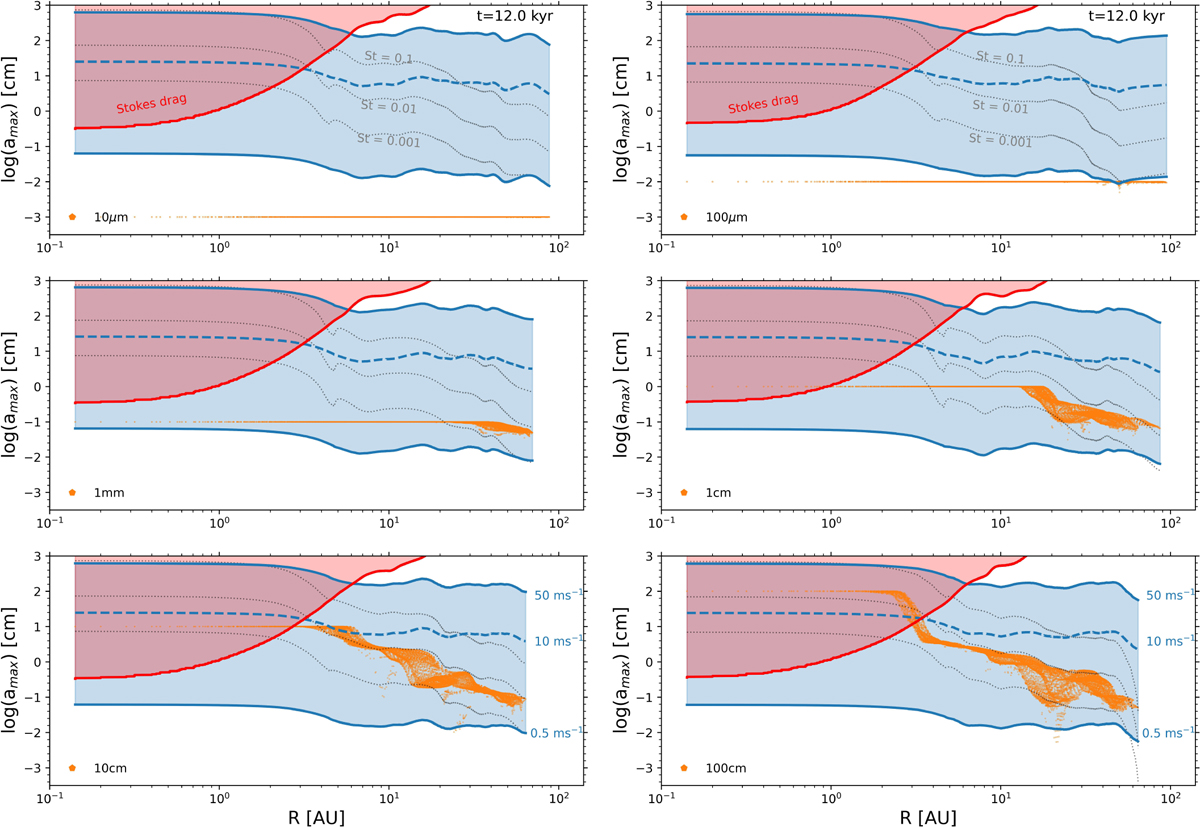
Radial profiles of the maximum dust size amax (orange symbols), for all six models with different maximum allowed size, ![]() . The six panels (from left to right, top to bottom) correspond to models with
. The six panels (from left to right, top to bottom) correspond to models with ![]() =10 μm,
=10 μm, ![]() =100 μm,
=100 μm, ![]() =1.0 mm,
=1.0 mm, ![]() =1.0 cm,
=1.0 cm, ![]() =10 cm, and
=10 cm, and ![]() =100 cm. Blue curves indicate the maximum dust sizes in the fragmentation-limited dust growth regime for fragmentation velocities of 0.5 m s−1 (lower solid curve), 10 m s−1 (middle dashed curve), and 50 m s−1 (upper solid curve). Black dotted curves illustrate dust sizes for fixed Stokes numbers of 0.1, 0.01, and 0.001 (from top to bottom). The red curve marks the boundary between the Stokes and Epstein drag regimes.
=100 cm. Blue curves indicate the maximum dust sizes in the fragmentation-limited dust growth regime for fragmentation velocities of 0.5 m s−1 (lower solid curve), 10 m s−1 (middle dashed curve), and 50 m s−1 (upper solid curve). Black dotted curves illustrate dust sizes for fixed Stokes numbers of 0.1, 0.01, and 0.001 (from top to bottom). The red curve marks the boundary between the Stokes and Epstein drag regimes.
Current usage metrics show cumulative count of Article Views (full-text article views including HTML views, PDF and ePub downloads, according to the available data) and Abstracts Views on Vision4Press platform.
Data correspond to usage on the plateform after 2015. The current usage metrics is available 48-96 hours after online publication and is updated daily on week days.
Initial download of the metrics may take a while.