Fig. 5
Download original image
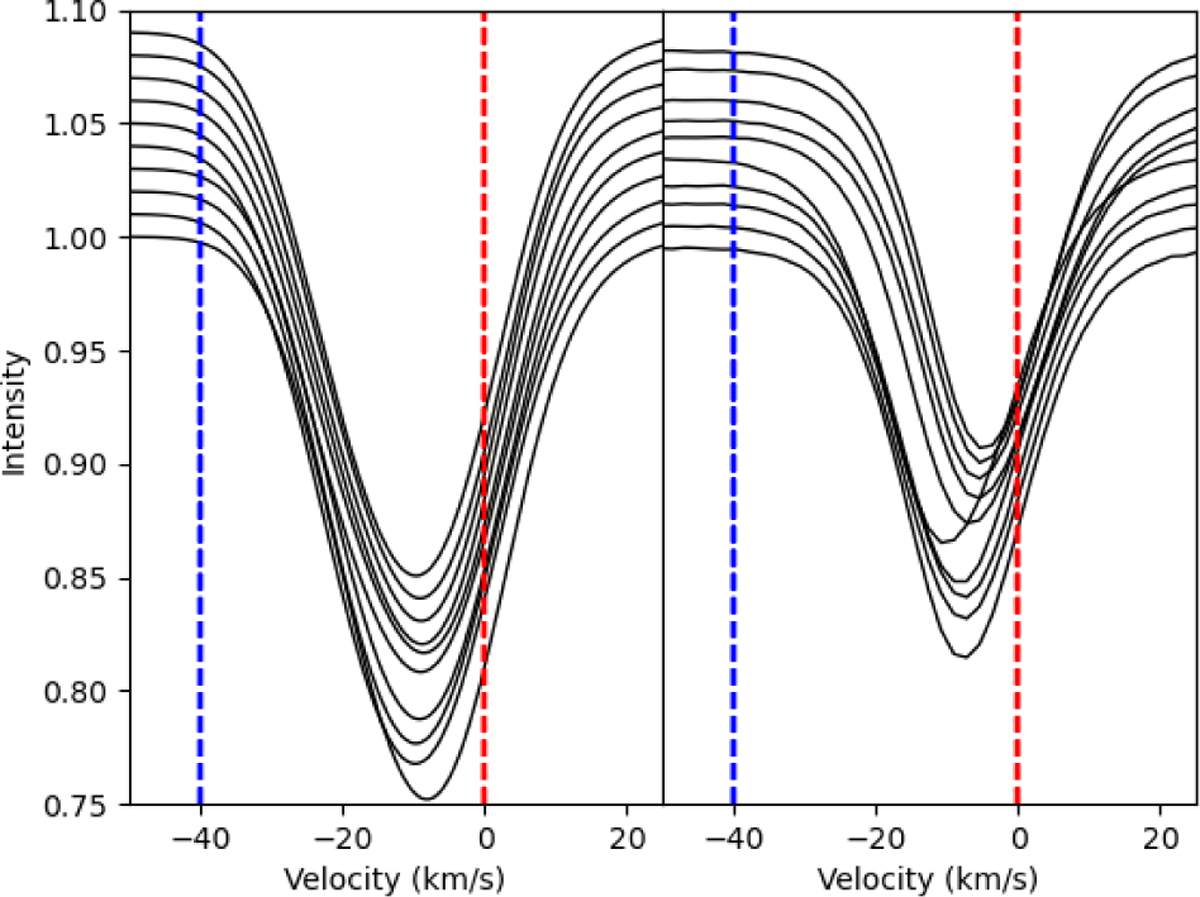
Left: inferred images of Betelgeuse from November 27, 2013, to March 3, 2015, used to integrate profiles under the assumption that, at every point, the gradient is such that the velocity reduces to 0 at the top of the line formation region (β = 1). Profiles are shifted in ordinates for clarity. Right: observed intensity profiles from those same dates.
Current usage metrics show cumulative count of Article Views (full-text article views including HTML views, PDF and ePub downloads, according to the available data) and Abstracts Views on Vision4Press platform.
Data correspond to usage on the plateform after 2015. The current usage metrics is available 48-96 hours after online publication and is updated daily on week days.
Initial download of the metrics may take a while.