Open Access
Fig. 3
Download original image
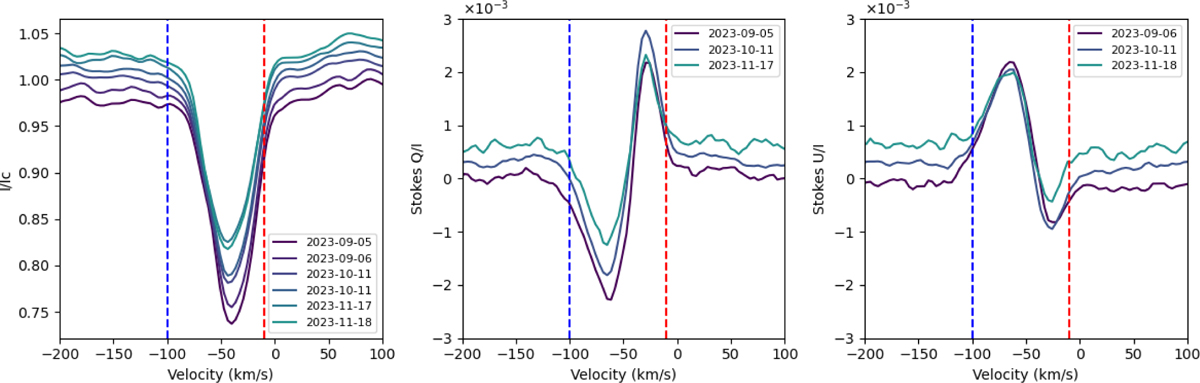
Examples of RW Cep profiles observed with NeoNarval in 2023, with dates indicated in the legend. Intensity is shown in the left plot, while Stokes Q and U are displayed in the center and right plots, respectively. The red and blue vertical dashed lines mark the chosen values of υ∗ and υmax, respectively.
Current usage metrics show cumulative count of Article Views (full-text article views including HTML views, PDF and ePub downloads, according to the available data) and Abstracts Views on Vision4Press platform.
Data correspond to usage on the plateform after 2015. The current usage metrics is available 48-96 hours after online publication and is updated daily on week days.
Initial download of the metrics may take a while.