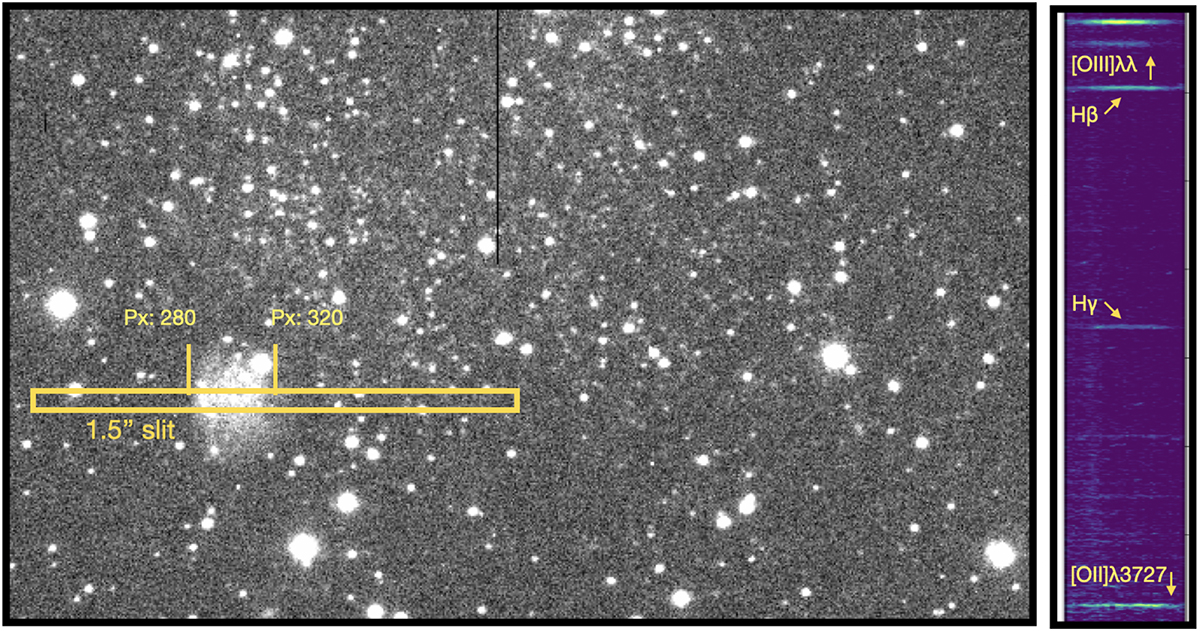
Fig. 7.
Download original image
Left panel: EFOSC2 pre-imaging frame of the SagDIG H II region. The yellow rectangle shows the slit position used to extract the 2D frame spectra. The vertical yellow lines indicate the area covered by the H II region, from column 280 to column 320. Right panel: 2D frame spectra, where the emission lines detected are indicated by yellow arrows.
Current usage metrics show cumulative count of Article Views (full-text article views including HTML views, PDF and ePub downloads, according to the available data) and Abstracts Views on Vision4Press platform.
Data correspond to usage on the plateform after 2015. The current usage metrics is available 48-96 hours after online publication and is updated daily on week days.
Initial download of the metrics may take a while.