Fig. 2.
Download original image
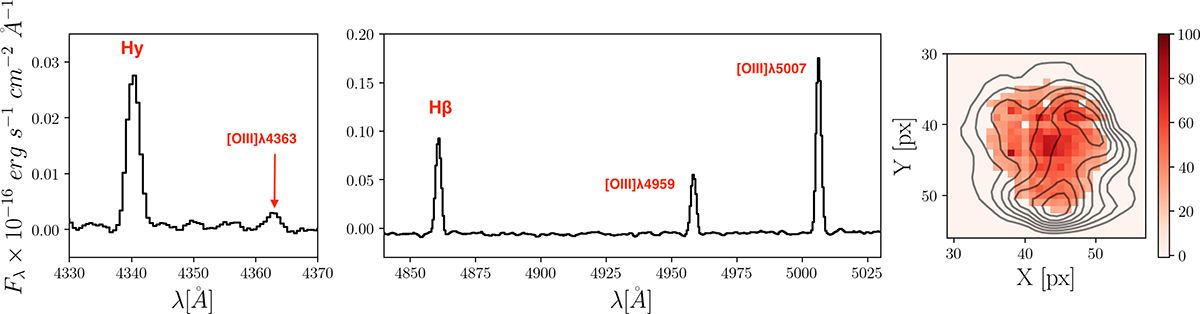
Integrated spectrum of the SagDIG H II region. The left panel shows the window wavelength of the Hγ and [O III]λ4363 emission lines. The middle panel shows the Hβ and [O III]λλ4959,5007 emission lines. The right panel shows the spatial distribution of the selected fibres to generate the integrated spectrum of the SagDIG H II region with auroral detection. The colour code represents the jump value of each selected fibre. The grey contours represent the Hβ emission of the nebula as reference.
Current usage metrics show cumulative count of Article Views (full-text article views including HTML views, PDF and ePub downloads, according to the available data) and Abstracts Views on Vision4Press platform.
Data correspond to usage on the plateform after 2015. The current usage metrics is available 48-96 hours after online publication and is updated daily on week days.
Initial download of the metrics may take a while.