Open Access
Fig. A.1.
Download original image
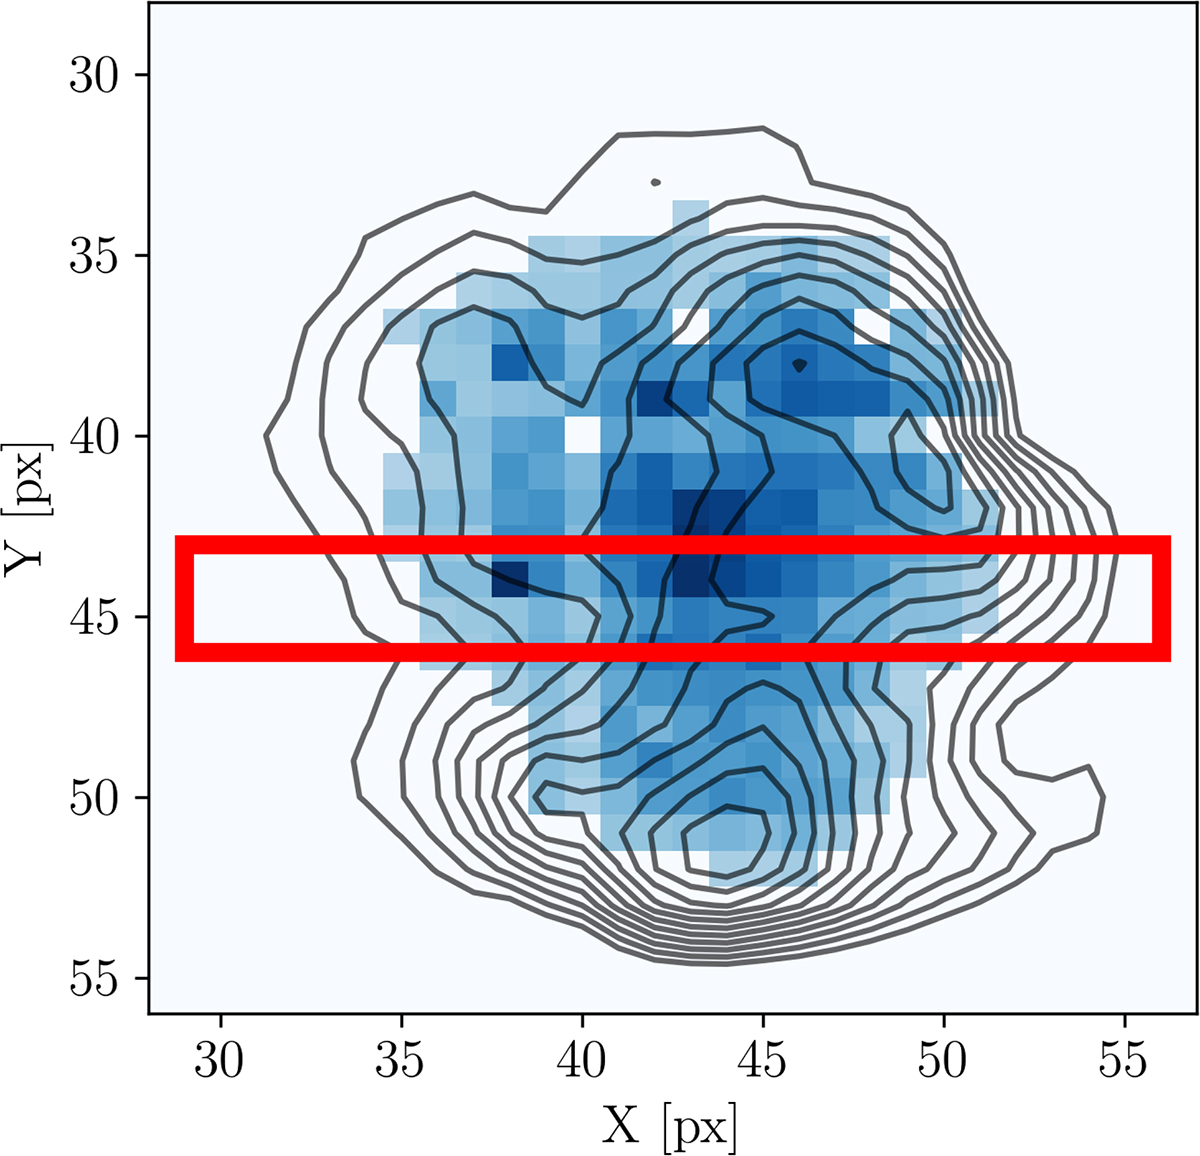
Simulated slit in the IFU data following the EFOSC2 long-slit observations of S02 marked with a red rectangle. The blueish pixels are those selected to generate the integrated SagDIG spectrum shown in Figure 2, with their respective jump value shown in the colour bar. The black contours represent the Hβ emission line map.
Current usage metrics show cumulative count of Article Views (full-text article views including HTML views, PDF and ePub downloads, according to the available data) and Abstracts Views on Vision4Press platform.
Data correspond to usage on the plateform after 2015. The current usage metrics is available 48-96 hours after online publication and is updated daily on week days.
Initial download of the metrics may take a while.