Fig. 11.
Download original image
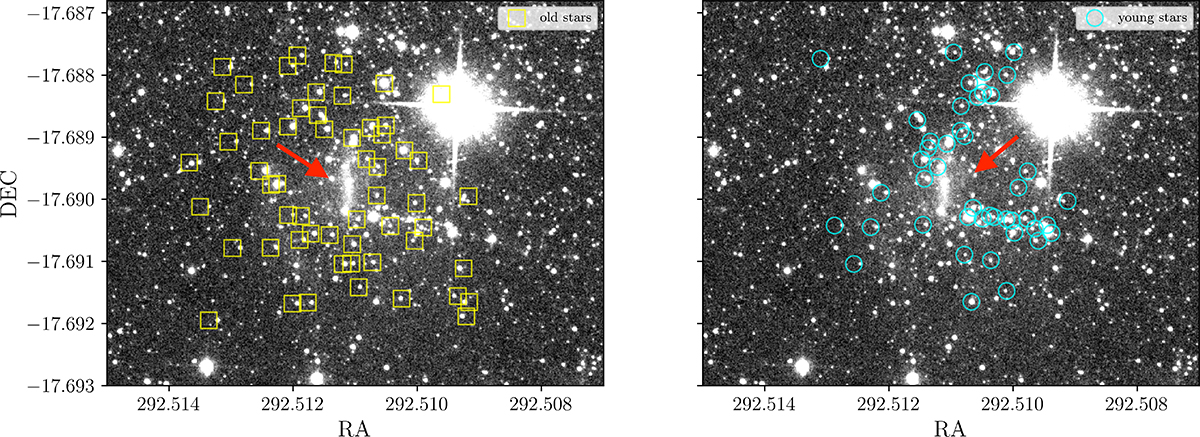
HST image (F475W, F606W and F814W combined) acquired by Momany et al. (2005) observations, showing the SagDIG H II region. The left panel shows the location of the old stellar population marked with yellow squares. The right panel shows the young stellar population marked with cyan circles. In both panels, the vertical diffuse column density is indicated with the red arrow. The source in the upper right region is a foreground star.
Current usage metrics show cumulative count of Article Views (full-text article views including HTML views, PDF and ePub downloads, according to the available data) and Abstracts Views on Vision4Press platform.
Data correspond to usage on the plateform after 2015. The current usage metrics is available 48-96 hours after online publication and is updated daily on week days.
Initial download of the metrics may take a while.