Fig. 10.
Download original image
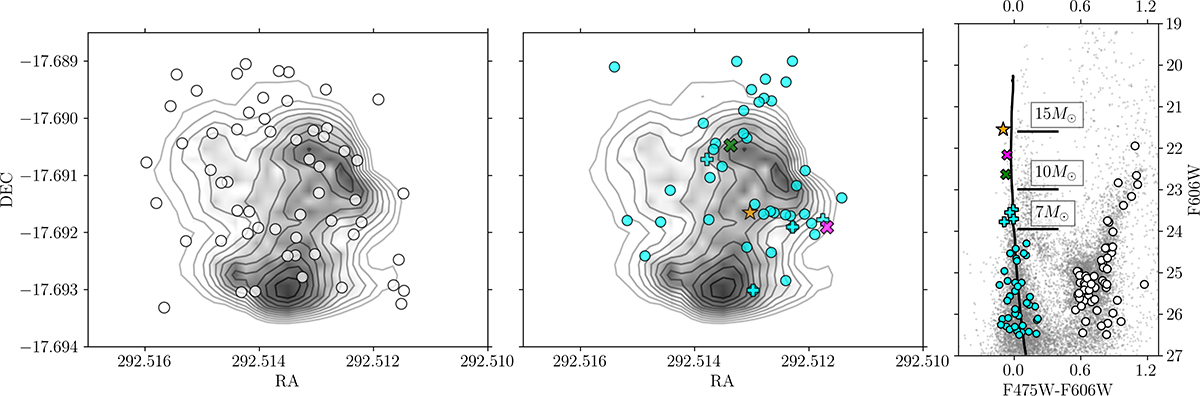
Comparison of the SagDIG H II region Hβ emission (black contours) with the stellar HST photometry from Momany et al. (2005). The left panel shows the old RGB and red clump stars (white dots) in the H II region. The middle panel shows the distribution of young MS stars (<7 M⊙ and 7−10 M⊙, indicated by cyan dots and cyan crosses, respectively) in the H II region. The orange star is the most luminous (15 M⊙), and the magenta and green crosses are the second and third (>10 M⊙) most luminous stars. The right panel shows the CMD of SagDIG, with the same symbols and colours as in the left and the middle panel. The vertical black curve is a 10 Myr isochrone, showing the MS of young stars to provide a proxy for the stellar masses of the young stars. The horizontal black lines show the corresponding range of masses in the main sequence.
Current usage metrics show cumulative count of Article Views (full-text article views including HTML views, PDF and ePub downloads, according to the available data) and Abstracts Views on Vision4Press platform.
Data correspond to usage on the plateform after 2015. The current usage metrics is available 48-96 hours after online publication and is updated daily on week days.
Initial download of the metrics may take a while.