Open Access
Fig. 1.
Download original image
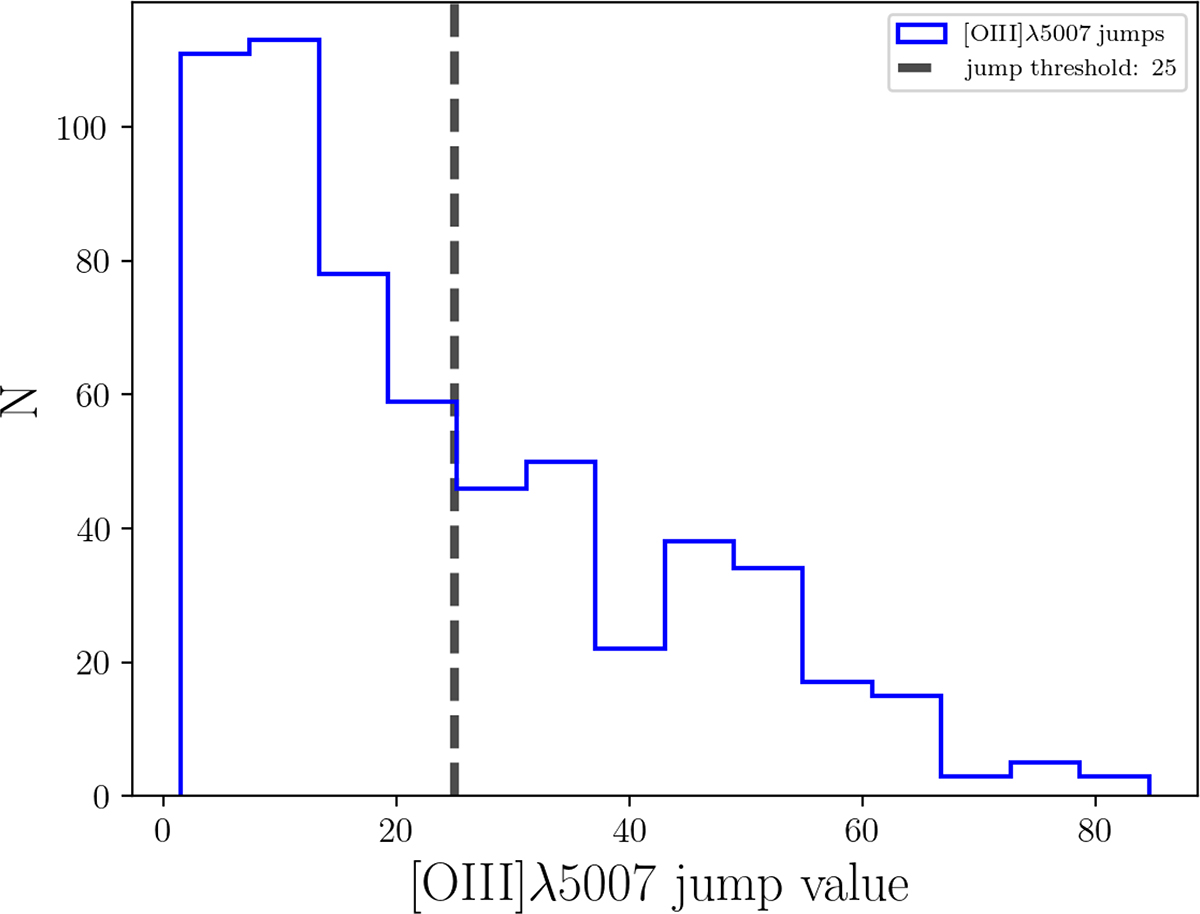
Distribution of jumps for SagDIG H II region spectral fibres shown in blue. The vertical dashed black line indicates the lower limit (25) used to select those fibres in which the integrated spectra of SagDIG H II show the auroral line with S/N > 3.
Current usage metrics show cumulative count of Article Views (full-text article views including HTML views, PDF and ePub downloads, according to the available data) and Abstracts Views on Vision4Press platform.
Data correspond to usage on the plateform after 2015. The current usage metrics is available 48-96 hours after online publication and is updated daily on week days.
Initial download of the metrics may take a while.