Fig. 6.
Download original image
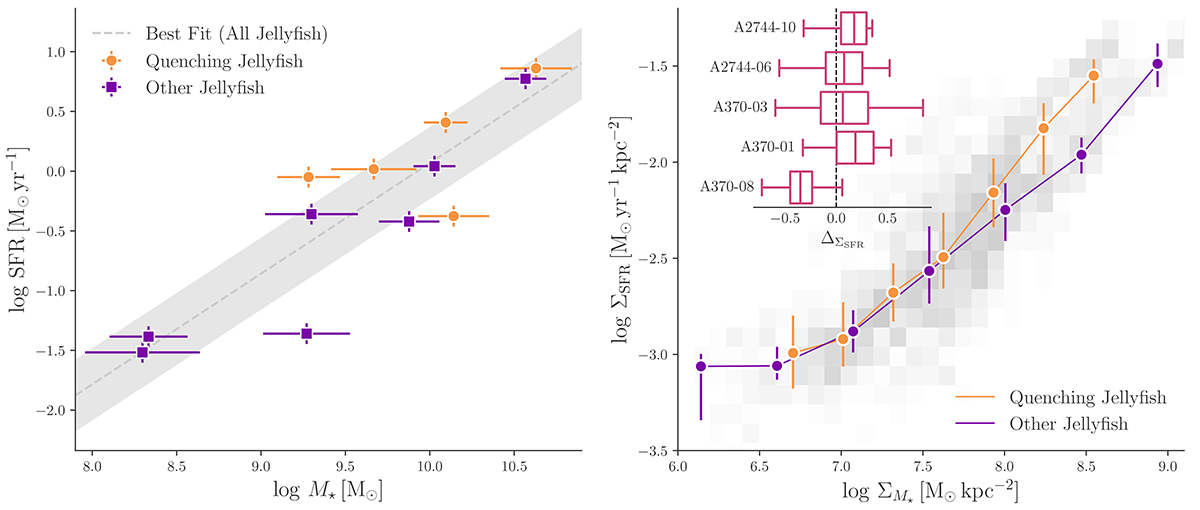
Star formation rate vs. log stellar mass (log M★) for jellyfish galaxies in our sample. The left panel shows the integrated SFS with quenching jellyfish galaxies in orange and other jellyfish galaxies in purple. The best-fit line is shown as a dashed gray line, and the shaded region represents its uncertainty. The panel to the right shows the spatially resolved relation. The spaxels of all jellyfish galaxies are shown as gray background. The orange and purple lines trace the median trends for quenching and nonquenching jellyfish galaxies, respectively. The points are plotted in the center of each bin we used to trace the median trend, and the vertical lines trace the interquartile ranges. The inset in the right panel shows box plots of the difference ![]() between the ΣSFR of spaxels in quenching jellyfish galaxies and the average ΣSFR of spaxels in other jellyfish galaxies that are in the same
between the ΣSFR of spaxels in quenching jellyfish galaxies and the average ΣSFR of spaxels in other jellyfish galaxies that are in the same ![]() range (±0.25 dex).
range (±0.25 dex).
Current usage metrics show cumulative count of Article Views (full-text article views including HTML views, PDF and ePub downloads, according to the available data) and Abstracts Views on Vision4Press platform.
Data correspond to usage on the plateform after 2015. The current usage metrics is available 48-96 hours after online publication and is updated daily on week days.
Initial download of the metrics may take a while.