Fig. 2.
Download original image
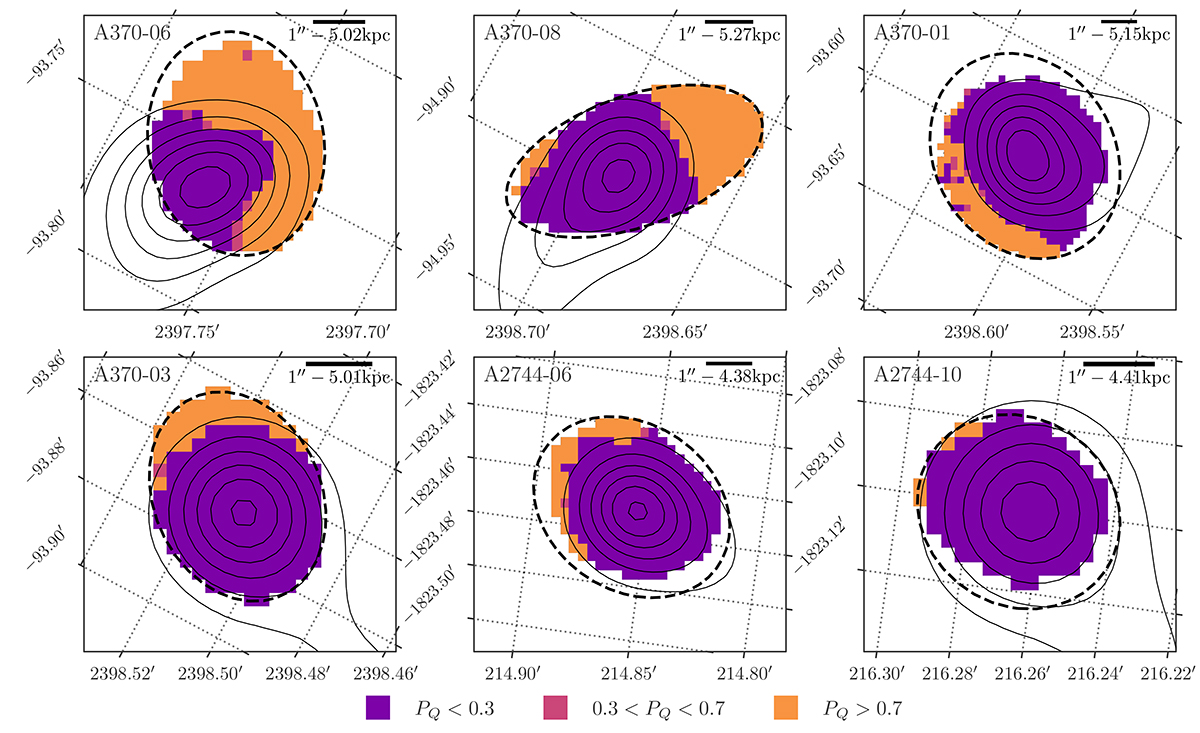
Maps of the quenching probability PQ for the six jellyfish galaxies undergoing quenching. The probability is shown as a purple-to-orange color map. Orange indicates a high quenching probability. The solid black contours show the [O II]λ3727 flux maps, smoothed with a 3σ Gaussian kernel. The dashed black lines show the best-fit ellipse to the the shape of each galaxy (g-band flux 3σ above background); any spaxels within the ellipse that are not plotted did not satisfy our S/N criterion and were not assigned a classification.
Current usage metrics show cumulative count of Article Views (full-text article views including HTML views, PDF and ePub downloads, according to the available data) and Abstracts Views on Vision4Press platform.
Data correspond to usage on the plateform after 2015. The current usage metrics is available 48-96 hours after online publication and is updated daily on week days.
Initial download of the metrics may take a while.