Fig. 6.
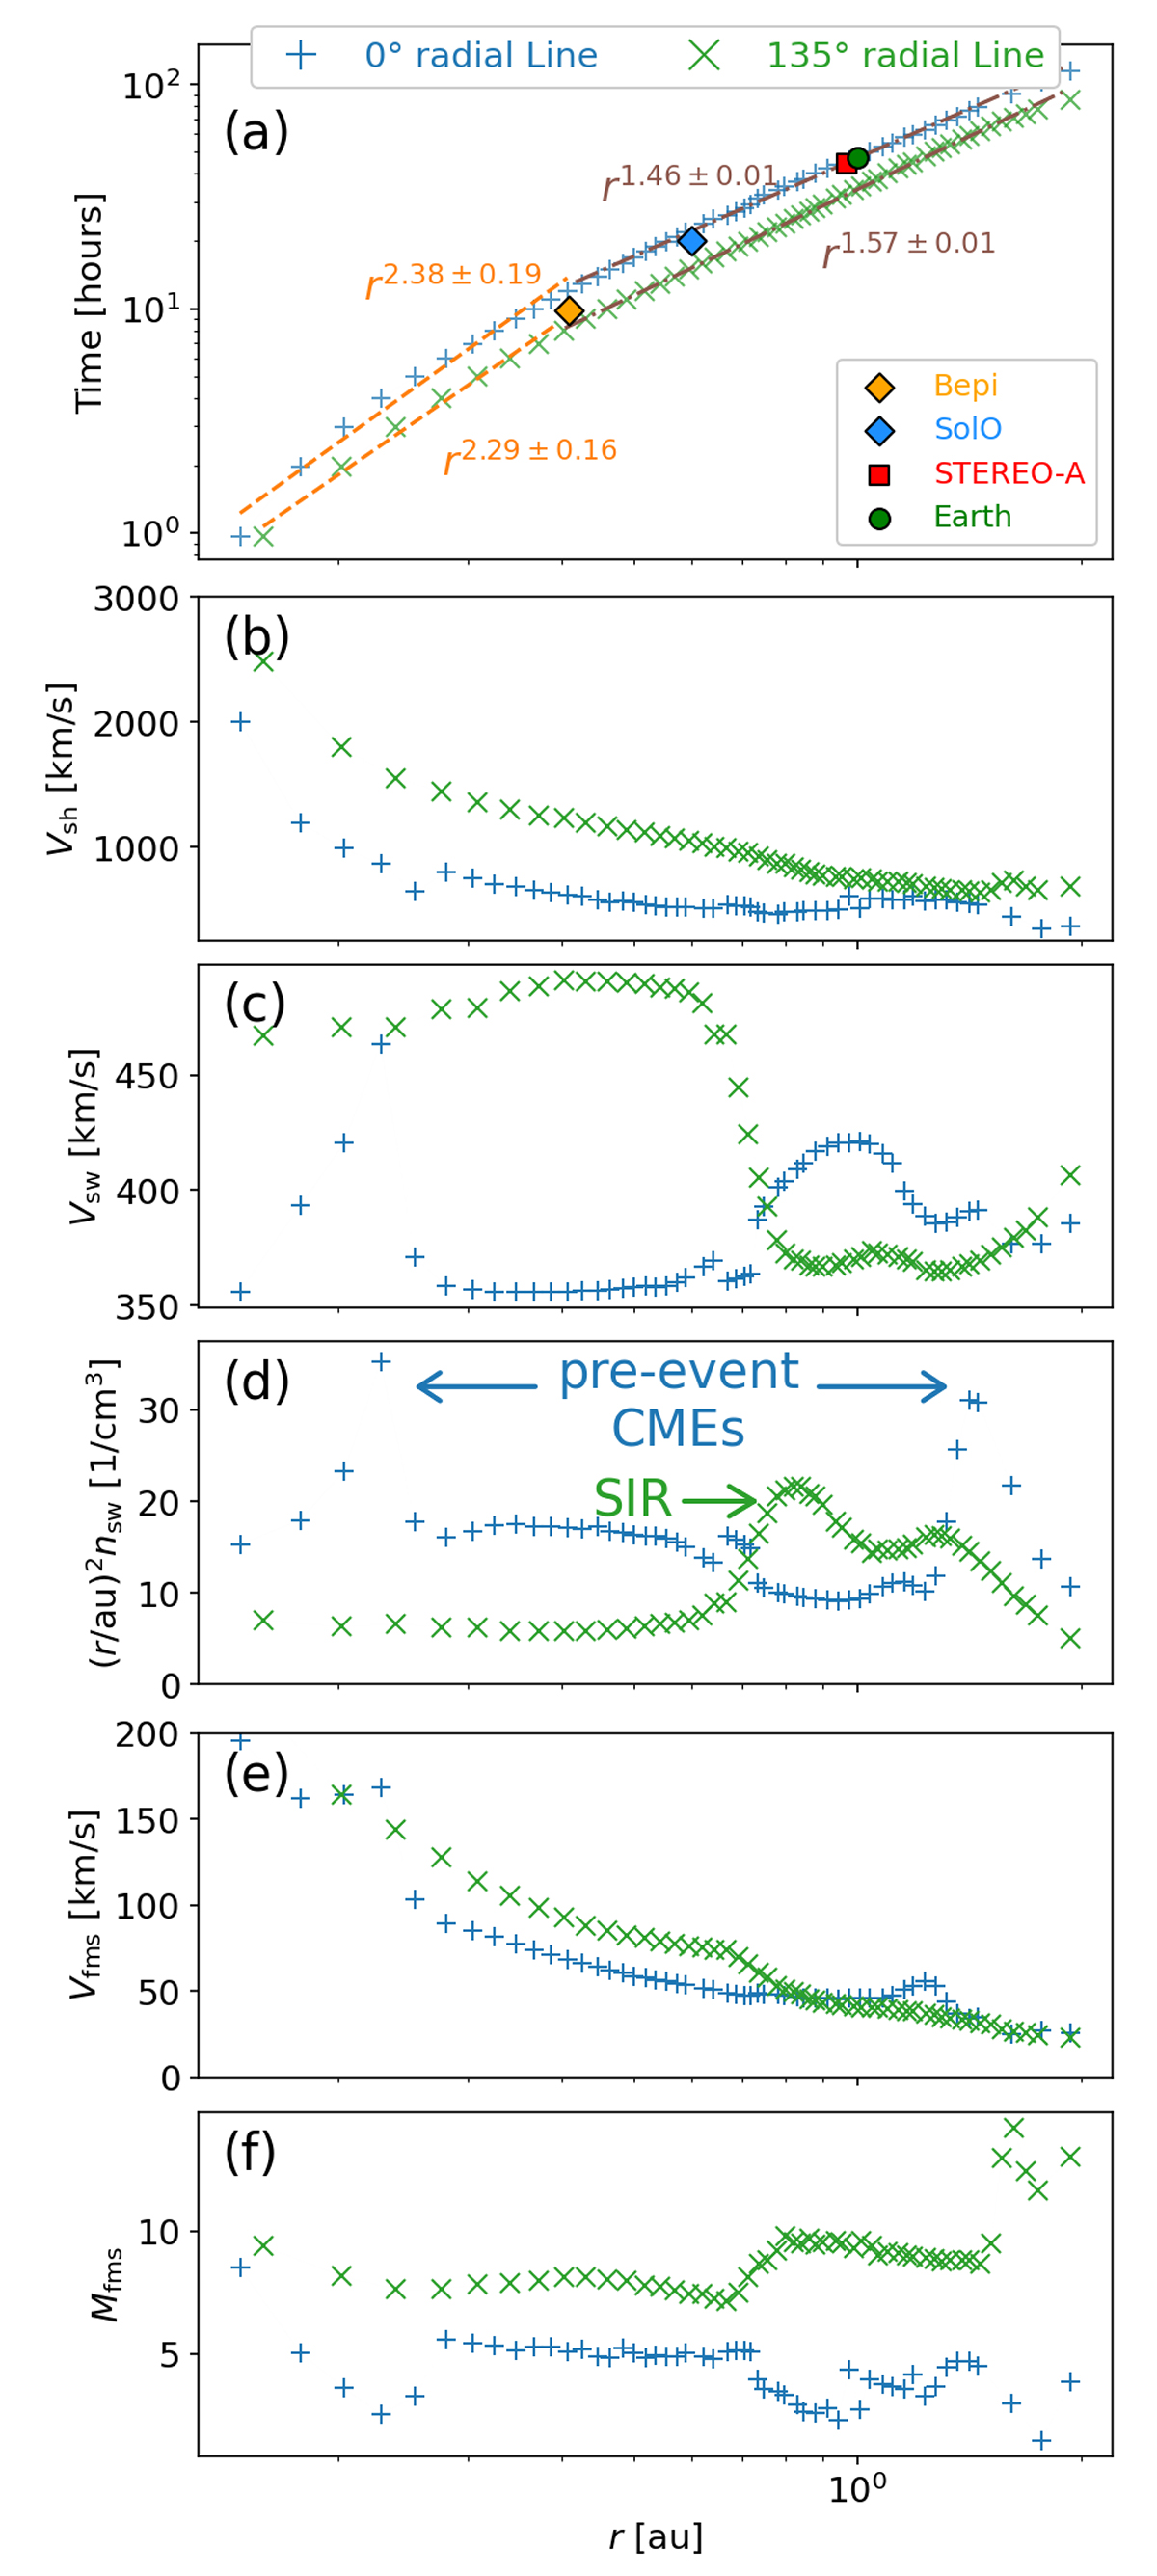
Download original image
Evolution of the main-event shock flanks along two radial directions in the solar equatorial plane. The blue symbols represent the line at 0°, aligned with the positive x-axis in Fig. 4, while the green symbols represent a line rotated 135° anti-clockwise from the positive x-axis. The panels present: (a) hours elapsed since the blast wave injection, including power-law fits and observed spacecraft shock crossing times; (b) shock speed; (c) upstream solar wind speed; (d) upstream solar wind density, scaled with r2; (e) upstream fast-magnetosonic speed; and (f) fast-magnetosonic Mach number (Mfms).
Current usage metrics show cumulative count of Article Views (full-text article views including HTML views, PDF and ePub downloads, according to the available data) and Abstracts Views on Vision4Press platform.
Data correspond to usage on the plateform after 2015. The current usage metrics is available 48-96 hours after online publication and is updated daily on week days.
Initial download of the metrics may take a while.