Fig. 2.
Download original image
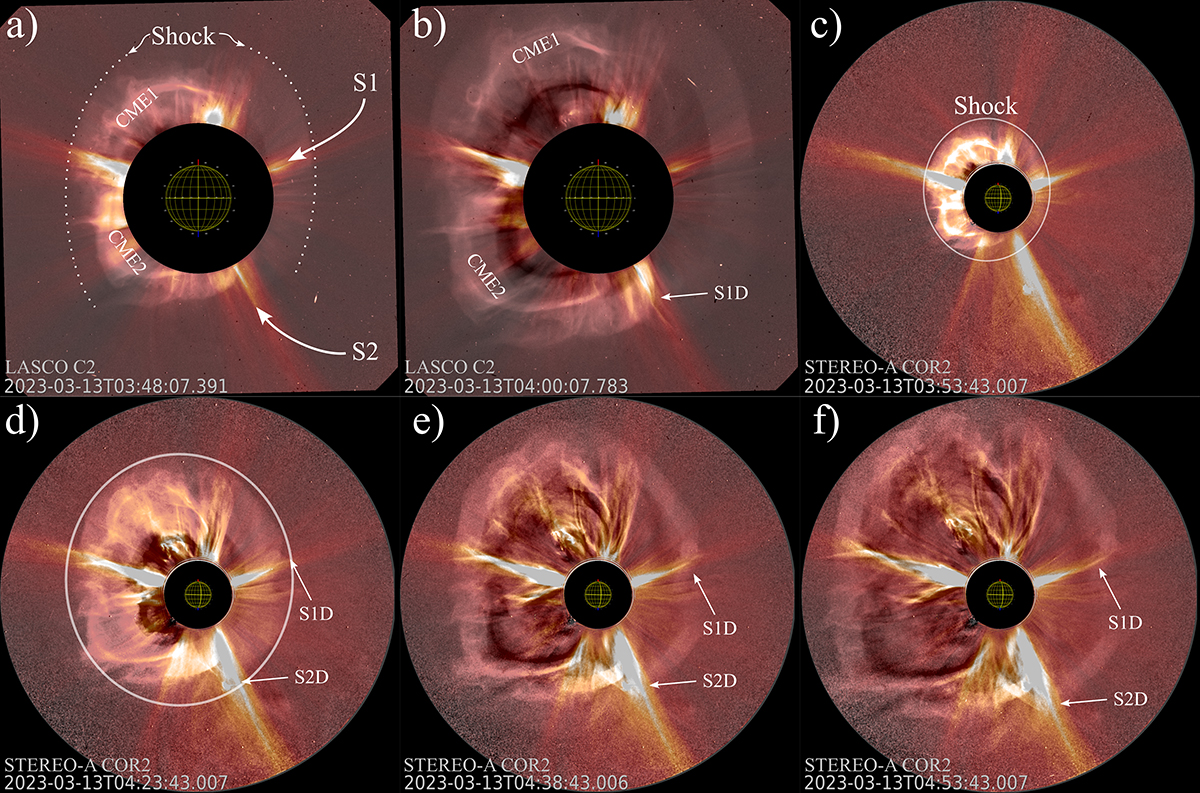
Selected snapshots of the CME evolution on 13 March 2023, as seen in coronagraphic observations from LASCO and STEREO-A. Each panel shows an overlay of a plain coronagraphic image and the corresponding running difference image at the same time from LASCO-C2 (panels a and b) and COR2-A (panels c to f). At selected frames we note the CMEs and outline the location of the CME-driven shock wave. The interaction of the shock with streamers (S1 and S2) are also noted in panels d to f (streamers deflections S1D and S2D). The various features are discussed in detail in Sect. 2.
Current usage metrics show cumulative count of Article Views (full-text article views including HTML views, PDF and ePub downloads, according to the available data) and Abstracts Views on Vision4Press platform.
Data correspond to usage on the plateform after 2015. The current usage metrics is available 48-96 hours after online publication and is updated daily on week days.
Initial download of the metrics may take a while.