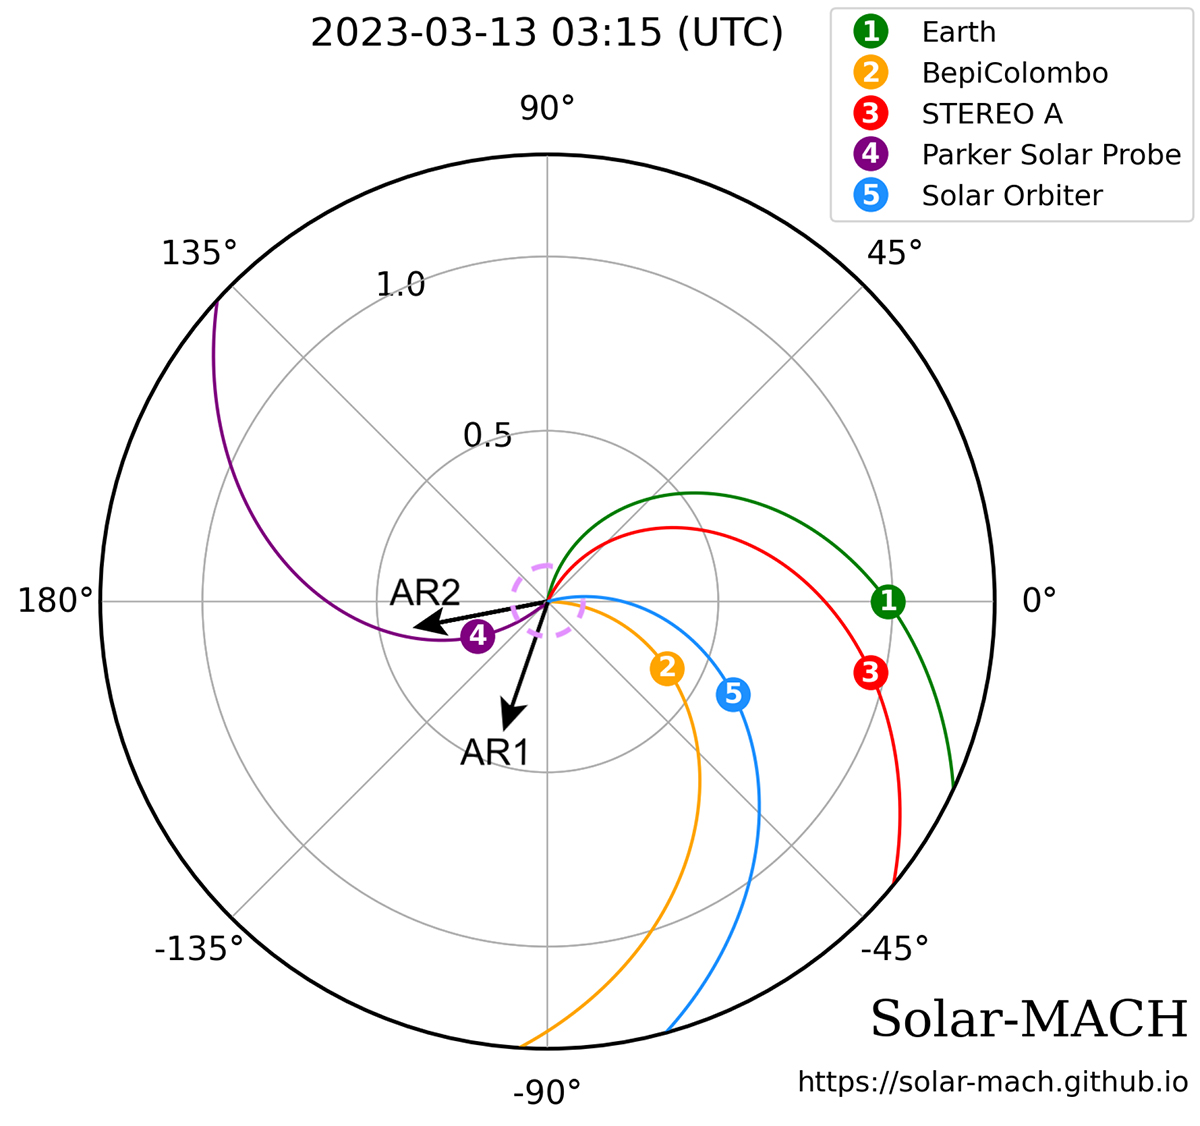
Fig. 1.
Download original image
Spacecraft constellation in the solar equatorial plane, showing nominal Parker spiral field lines connecting each spacecraft to the Sun. The field lines were derived using measured solar wind speeds for STEREO-A, Earth, and Parker Solar Probe, while for Solar Orbiter and BepiColombo, where no solar wind plasma data were available at the time of the event, solar wind speeds from the EUHFORIA simulation are used. The two arrows indicate the estimated locations of the ARs from which the CMEs erupted. The dashed pink line represents the combined extent of the two shock waves injected in the EUHFORIA simulation. This figure was made using the Solar-Mach tool (Gieseler et al. 2023).
Current usage metrics show cumulative count of Article Views (full-text article views including HTML views, PDF and ePub downloads, according to the available data) and Abstracts Views on Vision4Press platform.
Data correspond to usage on the plateform after 2015. The current usage metrics is available 48-96 hours after online publication and is updated daily on week days.
Initial download of the metrics may take a while.