Fig. 5
Download original image
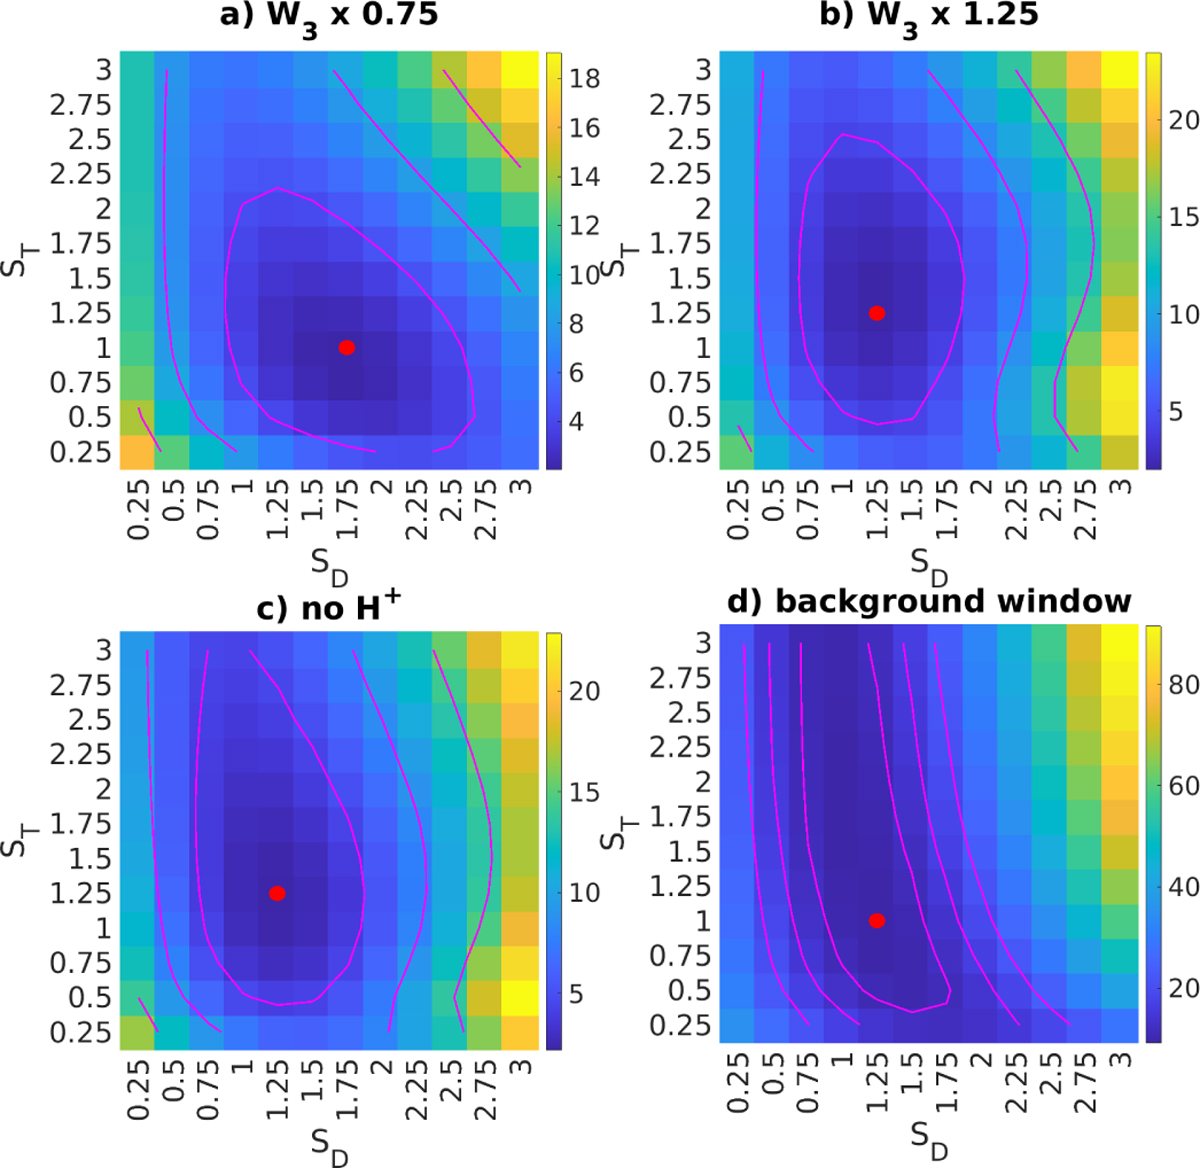
χ2 obtained by combining the IFP lead angle by the IPT radio occultations. Panels a and b are obtained from the reference IPT case by multiplying W3 in Eq. 1 by 0.75 and 1.25, respectively. Panel c is obtained by converting the protons into O+ to verify the effect of the high-latitude plasma. Panel d is obtained by reducing the time window used to calibrate the background and increasing the window used to compute the residuals (see text for details). Red dots indicate the absolute minimum and magenta lines mark the 1σ, 2σ, and 3σ confidence levels.
Current usage metrics show cumulative count of Article Views (full-text article views including HTML views, PDF and ePub downloads, according to the available data) and Abstracts Views on Vision4Press platform.
Data correspond to usage on the plateform after 2015. The current usage metrics is available 48-96 hours after online publication and is updated daily on week days.
Initial download of the metrics may take a while.