Open Access
Fig. 4
Download original image
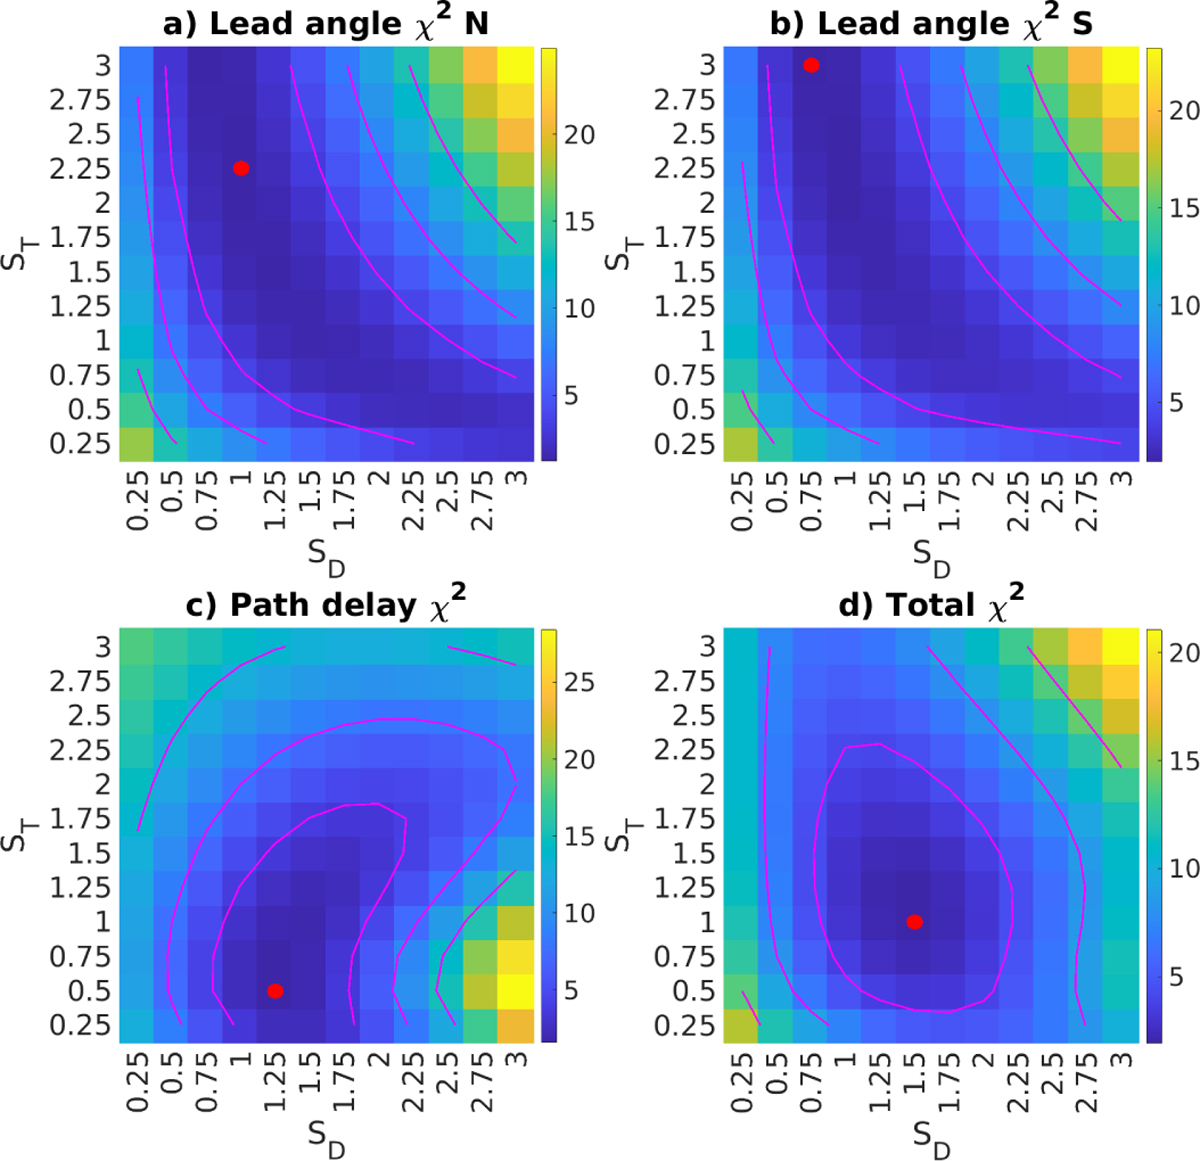
χ2 values obtained by the IFP northern and southern lead angle (panels a and b, respectively), IPT radio occultations (panel c), and combination of both datasets (panel d). Red dots indicate the absolute minimum and magenta lines represent the 1σ, 2σ, and 3σ confidence levels.
Current usage metrics show cumulative count of Article Views (full-text article views including HTML views, PDF and ePub downloads, according to the available data) and Abstracts Views on Vision4Press platform.
Data correspond to usage on the plateform after 2015. The current usage metrics is available 48-96 hours after online publication and is updated daily on week days.
Initial download of the metrics may take a while.