Fig. 3
Download original image
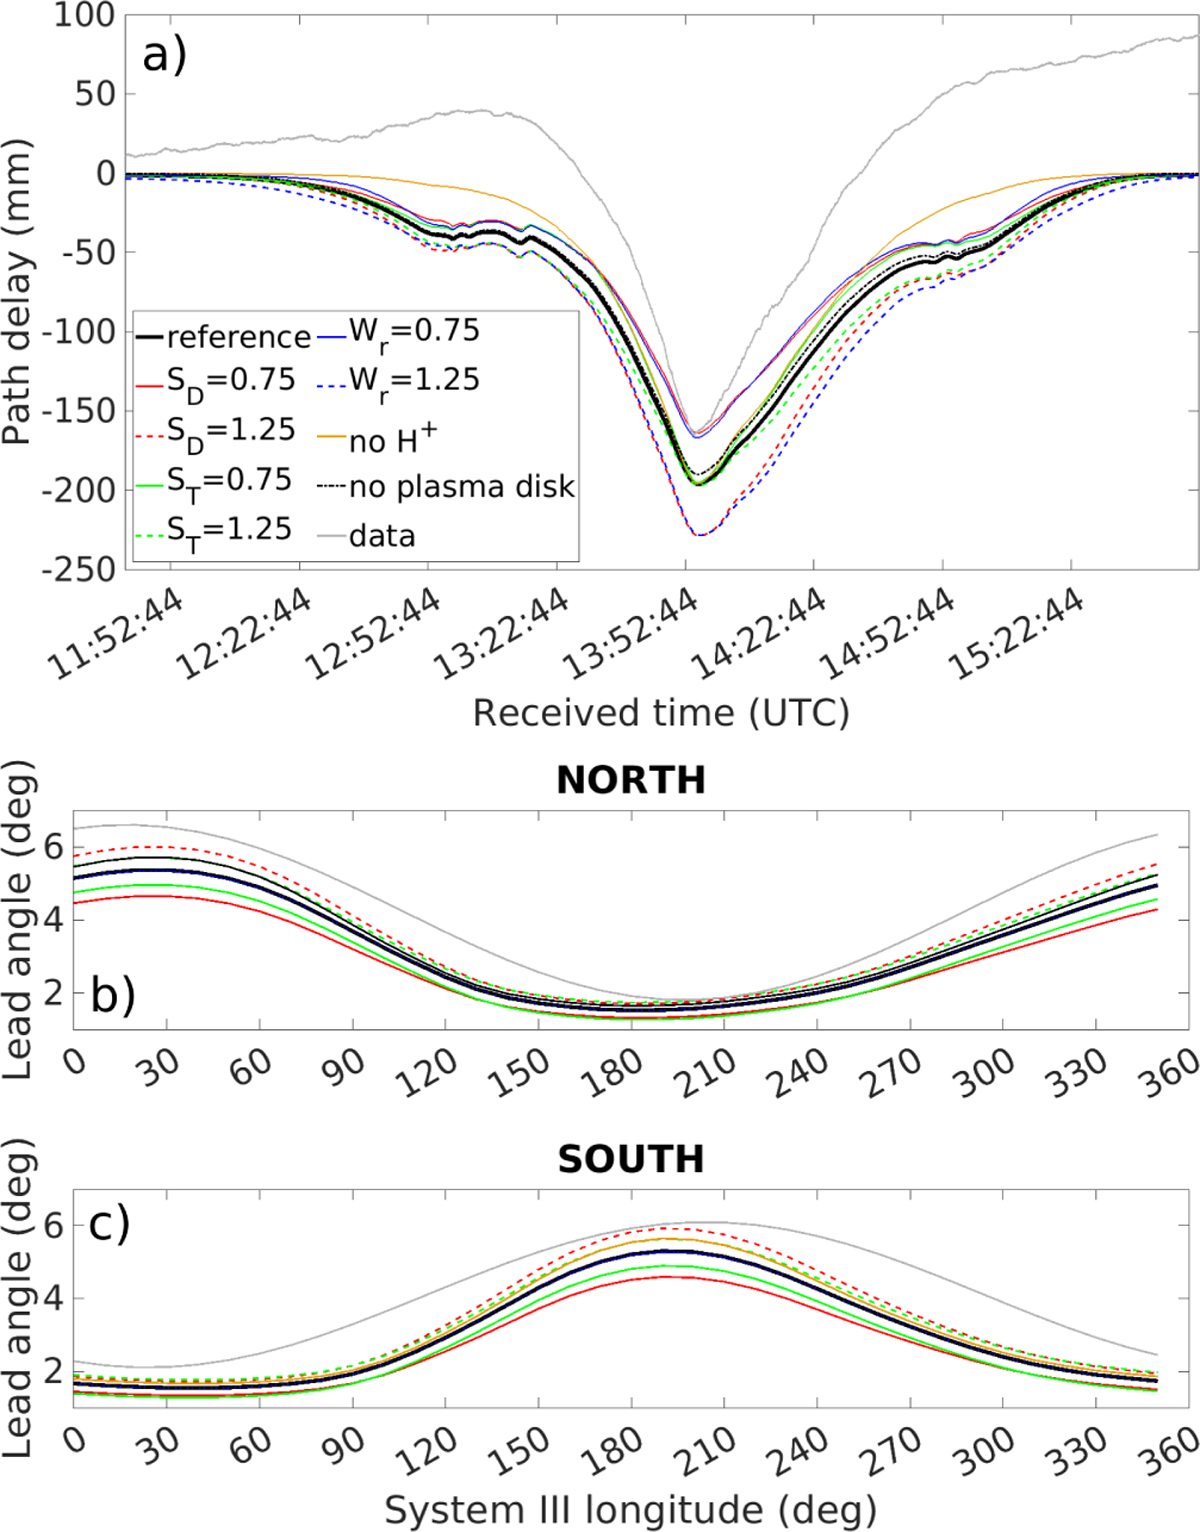
Path delay recorded on 27 August 2016 between 11:50 and 15:50 UTC (gray line, panel a), and average IFP lead angle obtained by Juno between 2016 and 2022 (gray lines, panel b and c for the north and south pole, respectively) are shown alongside simulations obtained from the model described in Section 3. The thick black line corresponds to the Voyager 1-based reference case. Red lines show results for increasing or decreasing peak density of the warm torus, green lines show temperature and blue lines show radial extension (variations of 25% with respect to the reference case). Solid lines indicate a decrease and dashed lines an increase. The thin black line is obtained from same reference model with all the protons replaced by O+. The dot-dashed line is obtained by removing the plasma contribution from the transition between the IPT and the plasma disk. In panels b and c, the blue lines and the dot-dashed line overlap with the reference case.
Current usage metrics show cumulative count of Article Views (full-text article views including HTML views, PDF and ePub downloads, according to the available data) and Abstracts Views on Vision4Press platform.
Data correspond to usage on the plateform after 2015. The current usage metrics is available 48-96 hours after online publication and is updated daily on week days.
Initial download of the metrics may take a while.