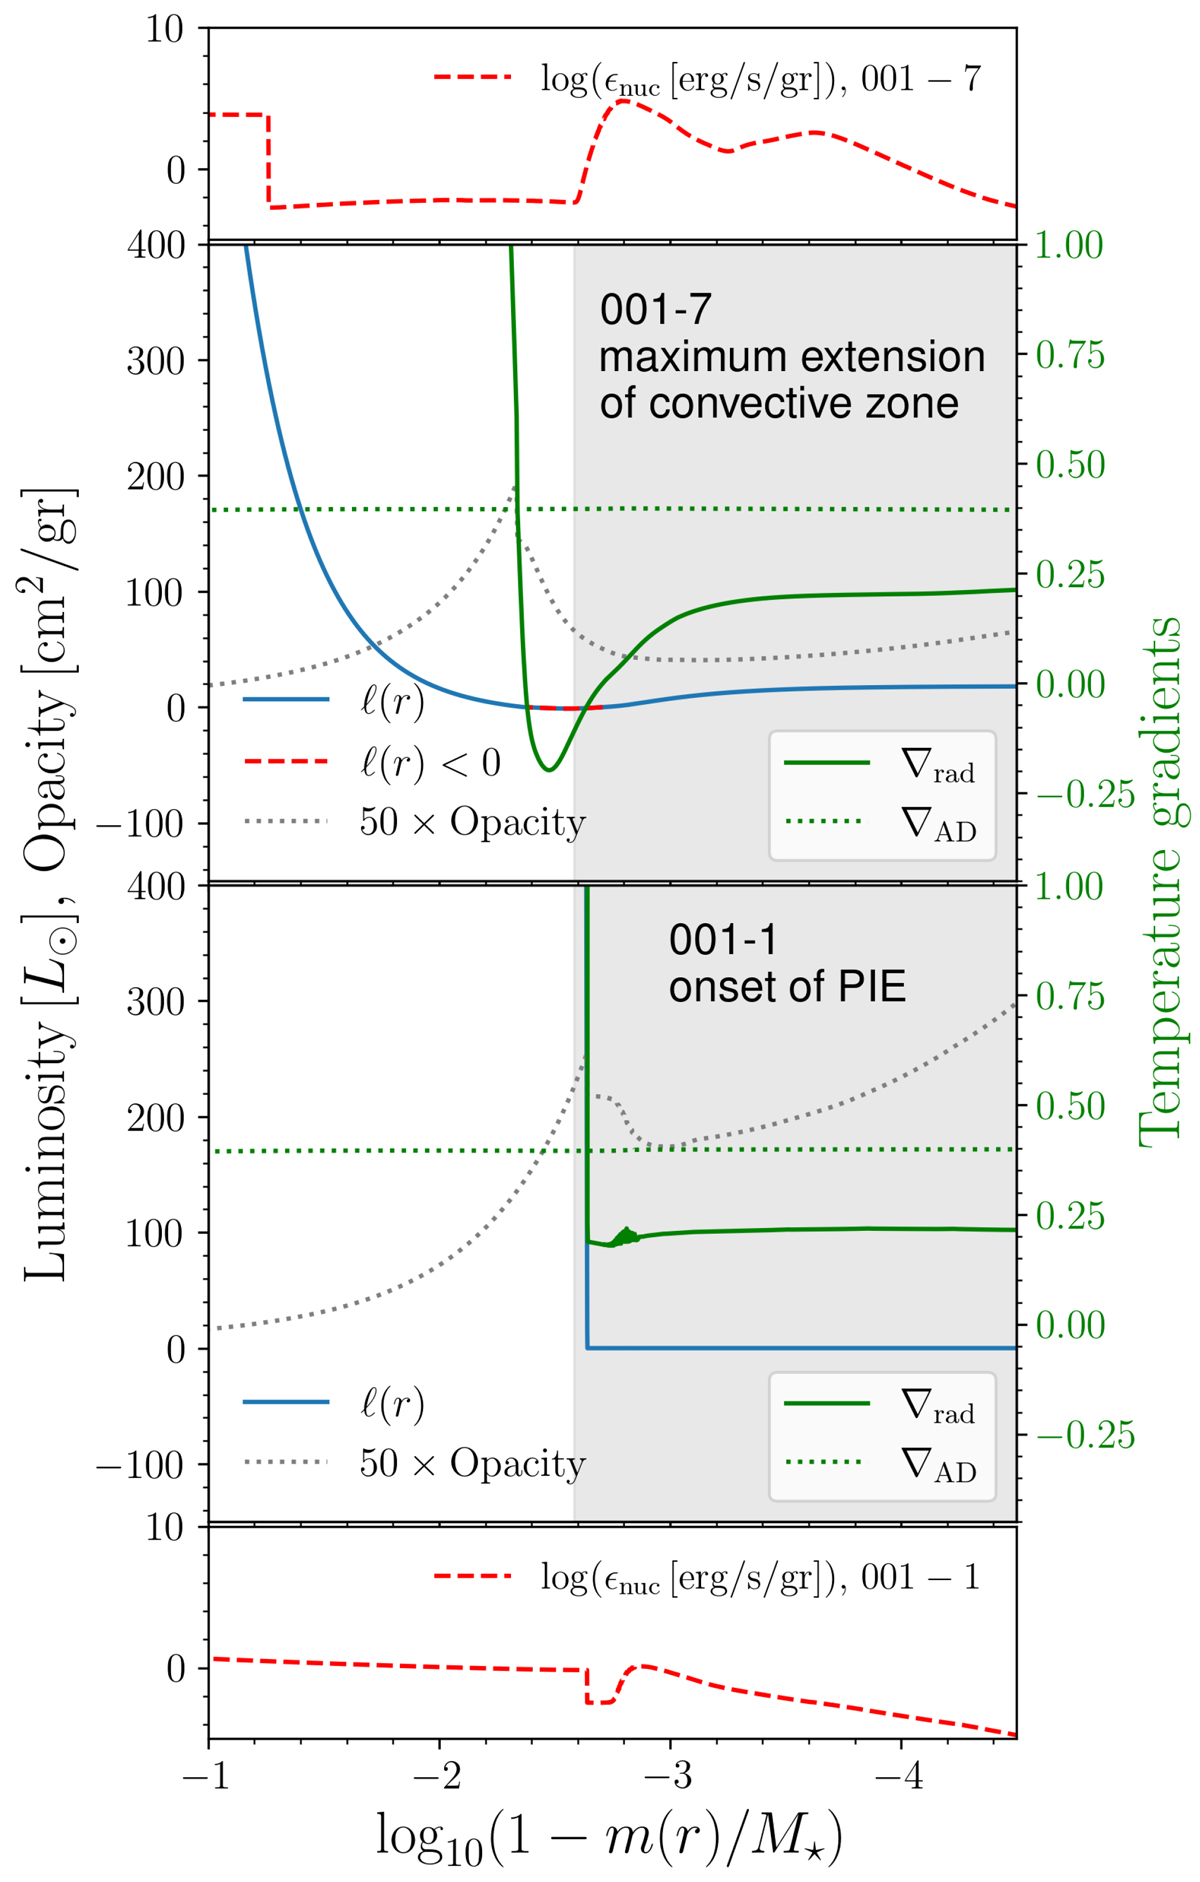
Fig. 9.
Download original image
Temperature gradients, luminosity, opacity, and energy liberated in two of our models. The two upper panels show these quantities for model 001-7 at the moment of the maximum extension of the He-flash driven convective zone, while the two lower panels correspond to the onset of PIE in model 001-1. The red dashed line in the uppermost and lowermost panels indicate the nuclear energy liberated in each model. The run of the luminosity is shown as solid blue lines. In the 001-7 model, a red-dashed line marks where the luminosity is negative. The opacity is shown as a gray dotted line, multiplied by 50 for clarity. The radiative and adiabatic temperature gradients correspond to the solid and dotted green lines respectively, with their values shown in the right y-axis.
Current usage metrics show cumulative count of Article Views (full-text article views including HTML views, PDF and ePub downloads, according to the available data) and Abstracts Views on Vision4Press platform.
Data correspond to usage on the plateform after 2015. The current usage metrics is available 48-96 hours after online publication and is updated daily on week days.
Initial download of the metrics may take a while.