Fig. 8.
Download original image
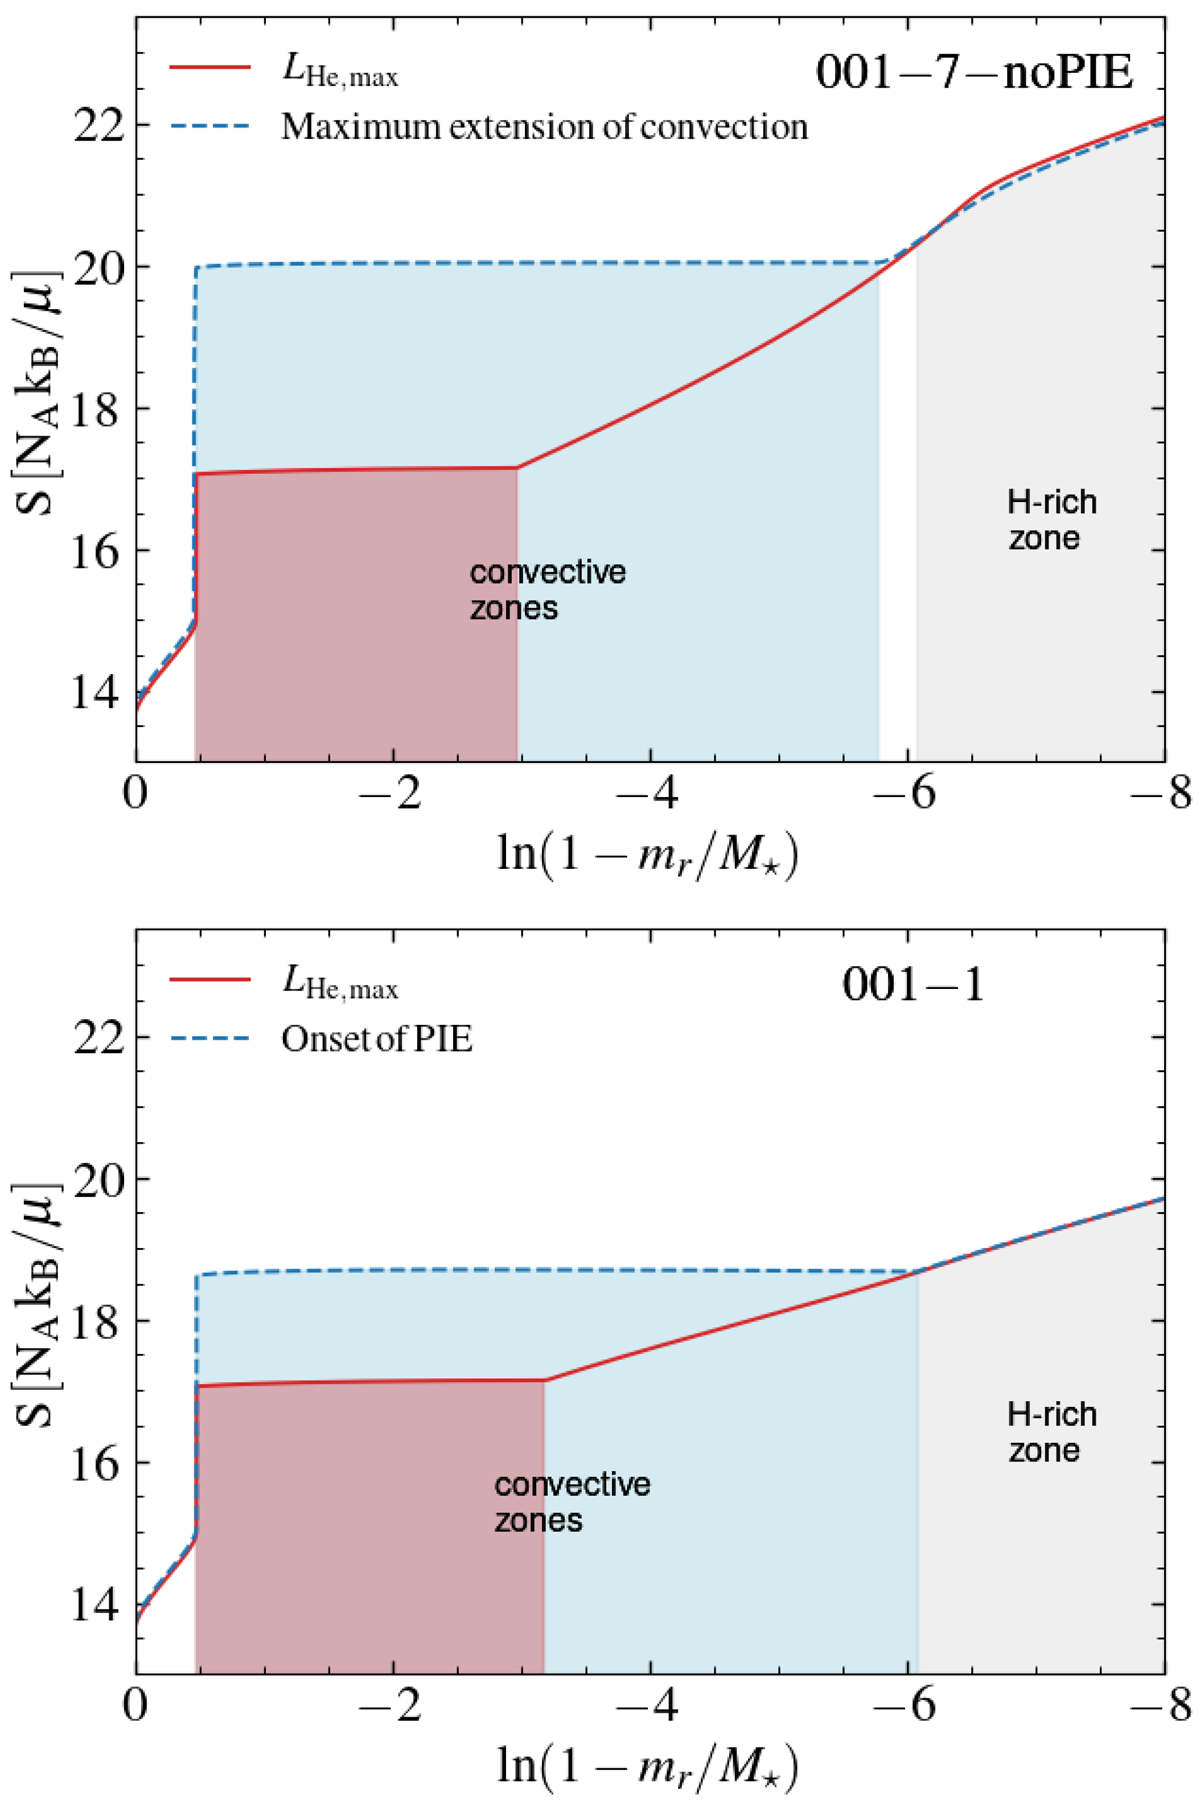
Lower panel: Specific entropy of model 001-1 at two different moments of the evolution. The red line corresponds to the peak of the He flash, meanwhile the blue dashed line corresponds to the onset of the PIE. The red- and blue-shaded areas are the convective zones at each of these stages. The gray shaded area corresponds to the H-rich envelope. Upper panel: Specific entropy of model 001-7, which does not experience a PIE. Here the blue dashed line corresponds to the moment of the evolution where the convective zone reaches its maximum extension.
Current usage metrics show cumulative count of Article Views (full-text article views including HTML views, PDF and ePub downloads, according to the available data) and Abstracts Views on Vision4Press platform.
Data correspond to usage on the plateform after 2015. The current usage metrics is available 48-96 hours after online publication and is updated daily on week days.
Initial download of the metrics may take a while.