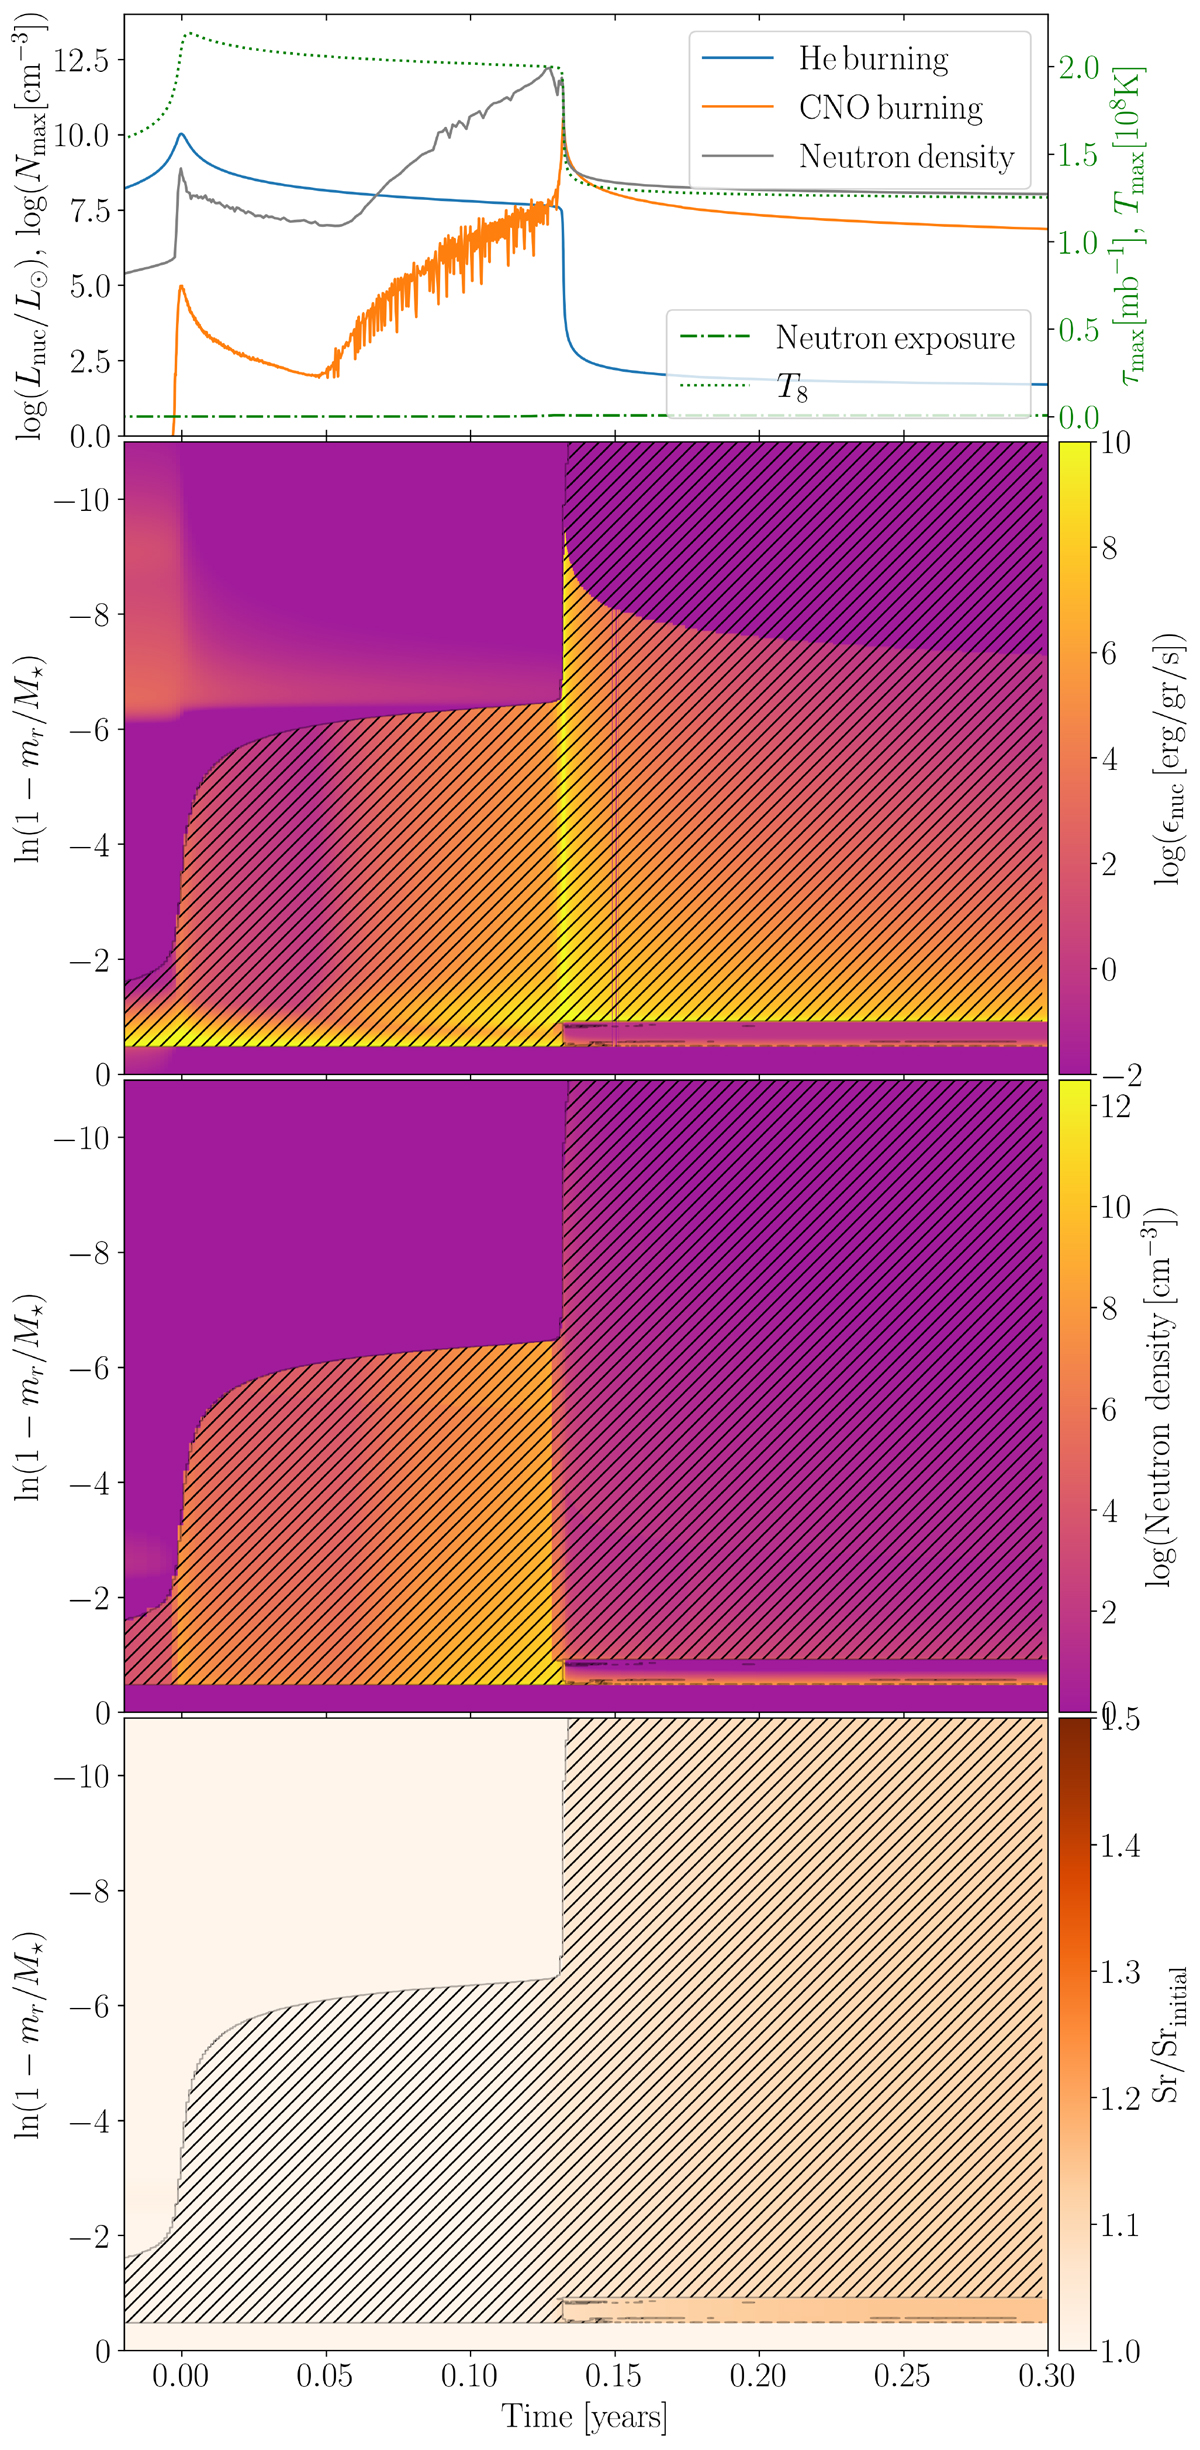
Fig. 4.
Download original image
Kippenhahn diagrams for model 001-1. The upper panel shows the evolution of the He burning luminosity (blue line), the CNO burning luminosity (orange line), and the neutron density (gray line). The right y-axis corresponds to the neutron exposure, shown in a dot-dashed green line, and the maximum temperature of the model at each time, shown in a dotted green line. In the Kippenhahn diagrams (the three lower panels) the convective zones are indicated as black dashed areas. The uppermost Kippenhahn diagram shows in color code the nuclear energy liberation. The middle Kippenhahn diagram shows the neutron density, and the lowermost Kippenhahn diagram shows the abundance of Sr respect to its initial value.
Current usage metrics show cumulative count of Article Views (full-text article views including HTML views, PDF and ePub downloads, according to the available data) and Abstracts Views on Vision4Press platform.
Data correspond to usage on the plateform after 2015. The current usage metrics is available 48-96 hours after online publication and is updated daily on week days.
Initial download of the metrics may take a while.