Open Access
Fig. B.1.
Download original image
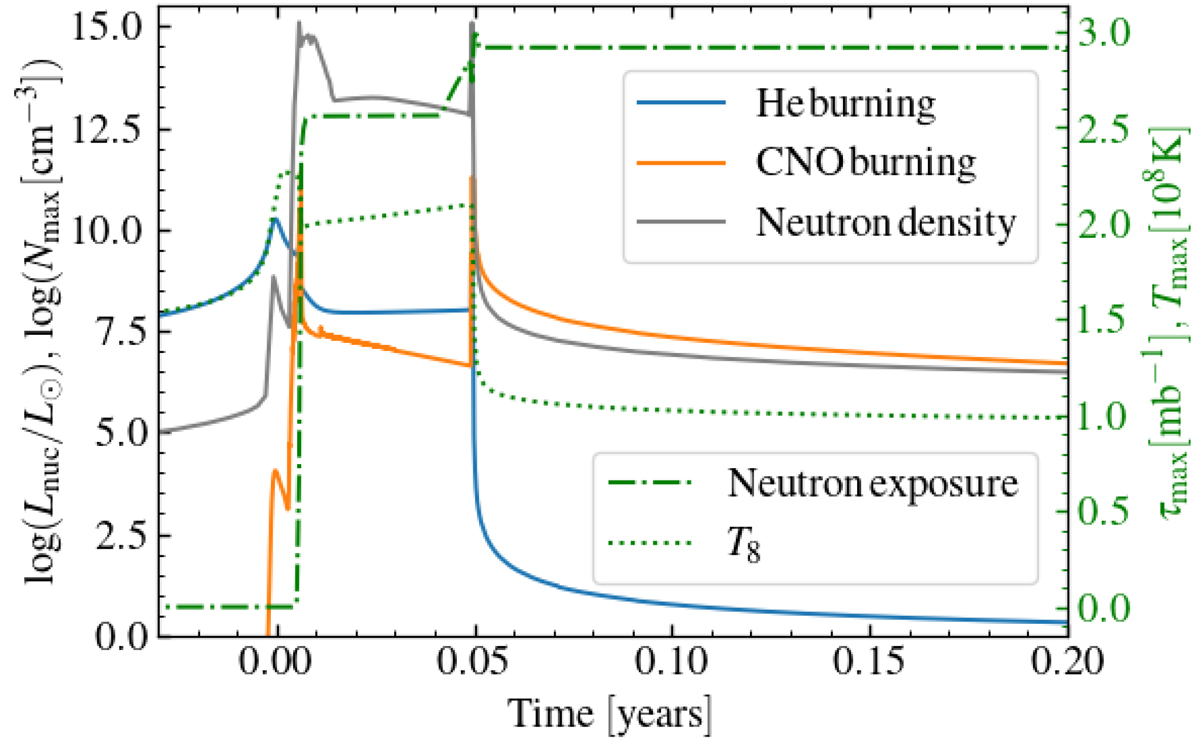
Evolution of the He burning luminosity (blue line), the CNO burning luminosity (orange line), the neutron density (gray line) for model 0001-1. The right y-axis corresponds to the neutron exposure, shown in a dot-dashed green line, and the maximum temperature of the model at each time, shown in a dotted green line.
Current usage metrics show cumulative count of Article Views (full-text article views including HTML views, PDF and ePub downloads, according to the available data) and Abstracts Views on Vision4Press platform.
Data correspond to usage on the plateform after 2015. The current usage metrics is available 48-96 hours after online publication and is updated daily on week days.
Initial download of the metrics may take a while.