Fig. 9
Download original image
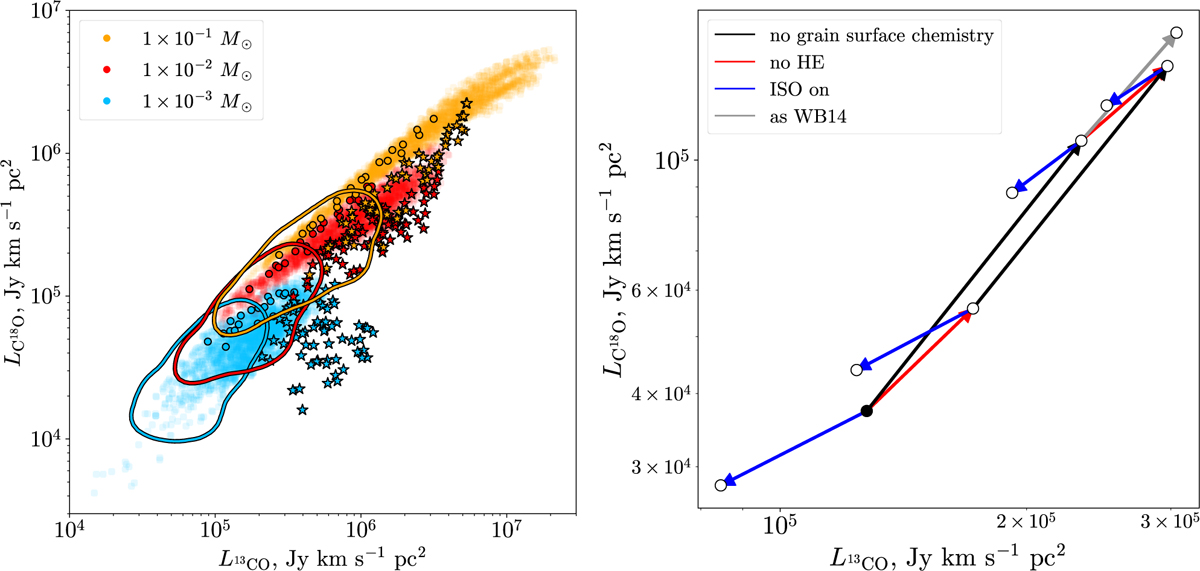
Luminosity diagrams for the C18O and 13CO lines. Left: translucent points are results of WB14 assuming CO/C18O = 550 and traced points are results of this work using the assumptions from WB14. Traced stars are results of M16 and contours are results of this work with the grain-surface chemistry network. The points and contours are colored according to the disk mass of the model. Right: points are values of individual test models. Black point is the grain-surface chemistry model, white points are modified versions of it. Color of the arrow shows the added modification to the model: grain chemistry turned off (black), parametric vertical structure (no HE, red), isotope-selective photodissociation (ISO on, blue), and the assumptions of WB14 (as WB14, gray). All models have the same parameters: Md = 0.01 M⊙, Rc = 60 au, M⋆ = 1.0 M⊙, L⋆ = 1.0 L⊙, and T⋆ = 4000 K. Models with parametric vertical structure have hc = 0.1, ψ = 0.1.
Current usage metrics show cumulative count of Article Views (full-text article views including HTML views, PDF and ePub downloads, according to the available data) and Abstracts Views on Vision4Press platform.
Data correspond to usage on the plateform after 2015. The current usage metrics is available 48-96 hours after online publication and is updated daily on week days.
Initial download of the metrics may take a while.